10-K: Annual report pursuant to Section 13 and 15(d)
Published on June 28, 2019

UNITED STATES
SECURITIES AND EXCHANGE COMMISSION
Washington, D.C. 20549
Form 10-K
|
☑ |
ANNUAL REPORT PURSUANT TO SECTION 13 OR 15(d) OF THE SECURITIES EXCHANGE ACT OF 1934 |
For the fiscal year ended April 30, 2019
OR
|
☐ |
TRANSITION REPORT PURSUANT TO SECTION 13 OR 15(d) OF THE SECURITIES EXCHANGE ACT OF 1934 |
For the transition period from ____to _____
Commission File Number 001-14505
KORN FERRY
(Exact Name of Registrant as Specified in its Charter)
|
Delaware |
|
95-2623879 |
|
(State or Other Jurisdiction of Incorporation or Organization) |
|
(I.R.S. Employer Identification No.) |
|
|
|
|
|
1900 Avenue of the Stars, Suite 2600, Los Angeles, California |
|
90067 |
|
(Address of Principal Executive Offices) |
|
(Zip Code) |
(310) 552-1834
(Registrant’s Telephone Number, Including Area Code)
Securities Registered Pursuant to Section 12(b) of the Act:
|
Title of Each Class |
Trading Symbol(s) |
Name of Each Exchange on Which Registered |
|
Common Stock, par value $0.01 per share |
KFY |
New York Stock Exchange |
Securities Registered Pursuant to Section 12(g) of the Act: None
Indicate by check mark if the registrant is a well-known seasoned issuer, as defined in Rule 405 of the Securities Act. Yes ☑ No ☐
Indicate by check mark if the registrant is not required to file reports pursuant to Section 13 or Section 15(d) of the Act. Yes ☐ No ☑
Indicate by check mark whether the registrant (1) has filed all reports required to be filed by Section 13 or 15(d) of the Securities Exchange Act of 1934 during the preceding 12 months (or for such shorter period that the registrant was required to file such reports), and (2) has been subject to such filing requirements for the past 90 days. Yes ☑ No ☐
Indicate by check mark whether the registrant has submitted electronically every Interactive Data File required to be submitted pursuant to Rule 405 of Regulation S-T (§232.405 of this chapter) during the preceding 12 months (or for such shorter period that the registrant was required to submit such files). Yes ☑ No ☐
Indicate by check mark whether the registrant is a large accelerated filer, an accelerated filer, a non-accelerated filer, a smaller reporting company, or an emerging growth company. See the definitions of “large accelerated filer,” “accelerated filer,” “smaller reporting company,” and “emerging growth company” in Rule 12b-2 of the Exchange Act.
|
Large accelerated filer |
☑ |
|
|
|
Accelerated filer |
☐ |
|
Non-accelerated filer |
☐ |
|
|
|
Smaller reporting company |
☐ |
|
Emerging growth company |
☐ |
|
|
|
|
|
If an emerging growth company, indicate by check mark if the registrant has elected not to use the extended transition period for complying with any new or revised financial accounting standards provided pursuant to Section 13(a) of the Exchange Act. ☐
Indicate by check mark whether the registrant is a shell company (as defined in Rule 12b-2 of the Exchange Act). Yes ☐ No ☑
The number of shares outstanding of our common stock as of June 21, 2019 was 56,436,120 shares. The aggregate market value of the registrant’s voting and non-voting common stock held by non-affiliates of the registrant on October 31, 2018, the last business day of the registrant’s most recently completed second fiscal quarter (assuming that the registrant’s only affiliates are its officers, directors and 10% or greater stockholders) was approximately $2,029,075,004 based upon the closing market price of $45.14 on that date of a share of common stock as reported on the New York Stock Exchange.
Documents incorporated by reference
Portions of the registrant’s definitive Proxy Statement for its 2019 Annual Meeting of Stockholders scheduled to be held on October 3, 2019 are incorporated by reference into Part III of this Form 10-K.
Index to Annual Report on Form 10-K for the Fiscal Year Ended April 30, 2019
|
Item # |
Description |
Page |
|
|
|
|
|
Item 1 |
1 |
|
|
Item 1A |
10 |
|
|
Item 1B |
23 |
|
|
Item 2 |
23 |
|
|
Item 3 |
23 |
|
|
Item 4 |
23 |
|
|
|
23 |
|
|
|
|
|
|
Item 5 |
25 |
|
|
Item 6 |
27 |
|
|
Item 7 |
Management’s Discussion and Analysis of Financial Condition and Results of Operations |
29 |
|
Item 7A |
49 |
|
|
Item 8 |
50 |
|
|
Item 9 |
Changes in and Disagreements With Accountants on Accounting and Financial Disclosure |
50 |
|
Item 9A |
50 |
|
|
Item 9B |
50 |
|
|
|
|
|
|
Item 10 |
51 |
|
|
Item 11 |
51 |
|
|
Item 12 |
Security Ownership of Certain Beneficial Owners and Management and Related Stockholder Matters |
51 |
|
Item 13 |
Certain Relationships and Related Transactions, and Director Independence |
51 |
|
Item 14 |
51 |
|
|
|
|
|
|
Item 15 |
52 |
|
|
Item 16 |
54 |
|
|
|
55 |
|
|
|
F-1 |
ABOUT KORN FERRY
Korn Ferry (referred to herein as the “Company” or in the first person notations “we,” “our,” and “us”) is a global organizational consulting firm, synchronizing our clients’ strategy and talent to drive superior business performance.
We operate in 104 offices in 52 countries, enabling us to deliver our solutions on a global basis, wherever our clients do business. As of April 30, 2019, we had 8,678 full-time employees, including 1,448 consultants who are primarily responsible for originating client services.
During fiscal 2019, we partnered with 13,834 client organizations. Our clients include many of the world’s largest and most prestigious public and private companies, middle market and emerging growth companies, as well as government and nonprofit organizations, including 98% of the Fortune 100 and 93% of the Financial Times Stock Exchange 100. We have built strong client loyalty, with 90% of our engagements in fiscal 2019 being completed on behalf of clients for whom we had conducted engagements in the previous three fiscal years.
We have made significant investments in our business that have strengthened our intellectual property (“IP”), enhanced our geographical presence, added complementary offerings to deepen client relationships and broadened our capabilities around talent acquisition, organizational strategy, assessment, development and rewards. Approximately 70% of our revenue comes from clients that utilize multiple lines of our business.
We were originally formed as a California corporation in November 1969 and reincorporated as a Delaware corporation in fiscal 2000.
On June 12, 2018, the Board of Directors of Korn Ferry approved a plan (the “Plan”) to go to market under a single, master brand architecture and to simplify the Company’s organizational structure by eliminating and/or consolidating certain legal entities and implementing a rebranding of the Company to offer the Company’s current products and services using the “Korn Ferry” name, branding and trademarks. In connection with the Plan, (i) the Company has sunset all sub-brands, including Futurestep, Hay Group and Lominger, among others, and (ii) effective as of January 1, 2019, the Company has been renamed “Korn Ferry.” The Company is continuing to harmonize under one brand to help the firm position itself as a preeminent organizational consulting firm and bring more client awareness to its broad range of talent management solutions. While the rebranding has not impacted the Company’s segment financial reporting, the Company renamed its Hay Group segment as Advisory and its Futurestep segment as RPO & Professional Search. The Company’s Executive Search segment name remains unchanged.
We file annual, quarterly and current reports, proxy statements and other documents with the Securities and Exchange Commission (the “SEC”), pursuant to the Securities Exchange Act of 1934, as amended (the “Exchange Act”). Our reports, proxy statements and other documents filed electronically with the SEC are available at the website maintained by the SEC at www.sec.gov.
We also make available, free of charge on the Investor Relations portion of our website at http://ir.kornferry.com, our annual, quarterly, and current reports, and, if applicable, amendments to those reports, filed or furnished pursuant to Section 13(a) or 15(d) of the Exchange Act as soon as reasonably practicable after we electronically file such reports with, or furnish them to, the SEC at www.sec.gov.
We also make available on the Investor Relations portion of our website at http://ir.kornferry.com press releases and related earnings presentations and other important information, which we encourage you to review.
Our Corporate Governance Guidelines, Code of Business Conduct and Ethics, and the charters of the Audit Committee, Compensation and Personnel Committee, and Nominating and Corporate Governance Committee of our Board of Directors are also posted on the Investor Relations portion of our website at http://ir.kornferry.com. Stockholders may request copies of these documents by writing to our Corporate Secretary at 1900 Avenue of the Stars, Suite 2600, Los Angeles, California 90067.
THE KORN FERRY OPPORTUNITY
Aligned around our vision to be the preeminent organizational consulting firm, we are pursuing an ambitious strategy that will help us to focus relentlessly on clients and collaborate intensively across the organization. This approach builds on the best of our past and gives us a clear path to the future with focused initiatives to increase our client and commercial impact.
Korn Ferry is transforming how clients address their talent management needs. We have evolved from a mono-line business to a global organizational consulting firm, giving our consultants more frequent and expanded opportunities to engage with clients.
1
While most organizations can develop a sound strategy, they often struggle with how to make it stick. That is where we come in: synchronizing an organization’s strategy with its talent to drive superior performance. We help companies design their organization—the structure, roles and responsibilities—to seize these opportunities. In addition, we help organizations select and hire the talent they need to execute their strategy—and show them the best way to compensate, develop and motivate their people.
We do this through our five core solution sets:
Core Solutions
|
Organizational Strategy |
We map talent strategy to business strategy by designing operating models and organizational structures that align to them, helping organizations put their plans into action. We make sure they have the right people, in the right roles, engaged and enabled to do the right things. |
|
Assessment and Succession |
We provide actionable, research-backed insights that allow organizations to understand the true capabilities of their people so they can make decisions that ensure the right leaders are ready—when and where they are needed—now and in the future. |
|
Talent Acquisition |
From executive search to recruitment process outsourcing, we integrate scientific research with our practical experience and industry-specific expertise to recruit professionals of all levels and functions for client organizations. |
|
Leadership Development |
We help leaders at all levels of an organization achieve their vision, purpose and strategy. We combine expertise, science and proven techniques with forward thinking and creativity to build leadership experiences that help entry to senior level leaders grow and deliver superior results. |
|
Rewards and Benefits |
We help organizations design rewards to achieve their strategic objectives. We help them pay their people fairly for doing the right things—with rewards they value—at a cost the organization can afford. |
Integrated Solutions
Additionally, we deliver differentiated approaches for our clients through our integrated market offerings, which bring together our best thinking from across our core solutions. These offerings target specific client needs, guided by an ever-changing business environment.
One such strategic growth area is transaction services related to mergers and acquisitions (M&A) and divestitures. A key differentiator with this service is our ability to help organizations drive growth by aligning leadership, talent and culture to the investment thesis during the integration process—from the C-suite through all employee levels. We also help companies develop and execute cost optimization strategies around rewards, organization design and workforce planning, to prepare them for potential market volatility.
Other integrated offerings focus on our clients’ transformational challenges. Our digital transformation service helps clients execute on a digital operating model, including the introduction and integration of new agile ways of working. Rich proprietary data enables our clients to better deliver the right value proposition to attract, retain and engage digital talent. In addition, we help specific functional areas, such as HR, develop their future-state model within a digital environment.
Our diversity and inclusion (“D&I”) service helps clients innovate and grow by creating an inclusive culture and diverse workforce. Organizations are in different places on their D&I journeys, ranging from compliance-driven, values-driven, talent performance driven, and beyond. Therefore, we combine our insights into a single offering that can be tailored to different markets and buyers.
From core through integrated, across our solution portfolio, we have the advantage of best-in-class solutions, products and talent, coupled with deep market expertise, to deliver a seamless approach to organization, talent and rewards strategies. Our change management capabilities further support our clients, through the successful execution of their transformational strategies and the effective implementation of their people and culture programs.
OUR INTELLECTUAL PROPERTY AND TECHNOLOGY
We know what good looks like: We bring together the industry knowledge, assessments, and data to benchmark clients against the best. We offer a complete view of the talent they need and the talent they have. We know if their rewards are fair and effective. And we align their structures, role profiles, and people to support the strategy so that clients know where to focus their efforts to create lasting change in the organization.
2
At the core of our approach is deep IP and research that allows us to deliver meaningful business outcomes for our clients. We house all of this data inside our Talent Hub. With more than four billion data points in total, including 69 million assessments, profiles of eight million candidates, rewards data on 20 million professionals and engagement data on more than seven million professionals, our Talent Hub is the science-based engine that uses this rich data set to fuel all of our services, solutions and products, connecting dots to drive meaningful change.
Advanced Analytics
Core IP data and assets include proprietary leadership assessment, recruitment and development models, emotional and social competencies, human motives and values, job grading, engagement and rewards systems. We integrate and build upon our data sets using advanced modeling and artificial intelligence (“AI”) to produce predictive insights and deliver demonstrable client impact.
The Korn Ferry Institute
The Korn Ferry Institute, our research and analytics arm, unites three areas: agile client execution; applied research and analytics; and breakthrough innovation. These teams work together to help business and public-sector leaders understand the key trends and drivers of human and organizational performance, so that they make better, science-based decisions on critical leadership, people, management and policy issues.
At the highest level, the Korn Ferry Institute explores three themes:
|
|
1. |
People, organization and technology innovation; |
|
|
2. |
Data analytics for human and business performance; and |
|
|
3. |
New demographic trends. |
In the fiscal year ahead, we will continue to innovate and simplify our IP for greater leverage of our data set, driving even greater business impact.
INDUSTRY TRENDS
In this competitive global economic environment, our clients are seeking new pathways to drive operational excellence and superior performance outcomes. This trend is attractive to our sector, as organizations are increasingly turning to partners like Korn Ferry to synchronize their strategy with their talent as an answer to today’s most pressing business challenges, specifically:
|
|
▪ |
Achieving growth and cost synergies from M&A transactions without destroying employee engagement. |
|
|
▪ |
Having the right people, mindsets and structures to achieve successful digital transformations. |
|
|
▪ |
Managing potential market volatility by reducing cost in their reward structures and workforce mix. |
|
|
▪ |
Creating cultures of inclusion where diversity is intrinsically valued; where every individual is able to contribute fully; and where all talented people can advance through the organization regardless of their gender, background or other identifying factors. |
|
|
▪ |
Changing ingrained ways of thinking and building strategies that energize employees and drive performance in the face of disruptive change. |
|
|
▪ |
Improving the quality of service delivery in core functions to create strategic competitive advantage. |
In addition, we believe the following factors will have a long-term positive impact on our industry:
|
|
▪ |
Companies are actively in search of trusted advisors that can offer a full suite of organizational consulting products and solutions, to manage the multiple needs of their business on a global scale using a common language. |
|
|
▪ |
Over the next decade, demand for skilled workers will outstrip supply, resulting in a global talent shortage. Organizations must make talent strategy a key priority and take steps now to educate, train, and upskill their existing workforces. |
3
|
|
▪ |
There is an increasing demand for professionals with not just the right experience, but also the right leadership competencies, traits and drivers to meet the requirements of the position and organizational culture today and prepare it for tomorrow. |
|
|
▪ |
Executive management tenure continues to hover at historically low levels. |
|
|
▪ |
The balance of power is shifting from the employer to the employee, as more people take charge of their own careers and the gig economy continues to grow in popularity. |
|
|
▪ |
Talent mobility is being recognized as a critical driver in the recruitment, development and retention of an organization’s people, particularly their early career professionals. |
|
|
▪ |
Succession planning remains under heightened scrutiny amidst pressure to generate growth, shorter CEO tenures and the emphasis being placed on making succession planning a systemic governance process within global organizations. |
|
|
▪ |
Executive pay is under a perpetual spotlight, making it imperative that organizations get this right to ensure the public trust and establish a functional compensation strategy that starts right at the top. |
|
|
▪ |
Companies are more determined than ever to close the gender gap on pay and advancement to leadership roles. |
|
|
▪ |
More companies are maintaining strategic focus by choosing to outsource non-core functions like talent acquisition to RPO providers who can offer efficient, high-quality services. |
GROWTH STRATEGY
Our objective is to expand our position as the preeminent organizational consulting firm. In order to meet this objective, we will continue to pursue our multi-pronged strategy:
Drive a One Korn Ferry Go-to-Market Strategy
Our synergistic go-to-market strategy, bringing together our core solutions, is driving more integrated, scalable client relationships. This is evidenced by the fact that approximately 70% of our revenues come from clients that utilize multiple lines of our business. Additionally, our Net Promoter Score, a metric used to gauge customer loyalty, has increased by three points compared to last year. To better compete in the market, we will continue to evolve from our traditional line of business segmentation to integrated solutions and industries.
Our Marquee Accounts program is a core pillar of our go-to-market strategy. This program drives major global and regional strategic account development, in addition to providing a framework for all our client development activities as we move our firm to deeper client relationships. Our Marquee Accounts program now comprises 21% of our global fee revenues. In the year ahead, we will continue to grow and expand our account management activities. This includes driving consistent account selection, assignment, planning and execution; implementing account-based marketing efforts; optimizing the pipeline and opportunity process; integrating our best thinking across solutions; and hiring additional dedicated account leaders. We will also expand this successful go-to-market program to the next level of accounts—our Regional Accounts program.
Another pillar of our growth strategy is the Products business. In fiscal 2019, product sales comprised 31% of our Advisory revenue. Our subscription services delivered online help us generate long-term relationships with our clients through large scale and technology-based human resources (“HR”) programs. We continue to seek ways to further scale these highly profitable products to our global clients.
Deliver Client Excellence and Innovation
Technology is positioned to reshape the future of work and with it, the workforce as we know it today. Market innovations contribute to more accurate, faster, cost-effective and impactful business and human decisions. Our firm is well positioned in that context. We have a set of assets that are critical to such decisions: deep science on organization and human motivation, data on talent, work and rewards, and proven products and solutions.
4
We are combining our IP and technology into a unified single platform to allow clients to make faster, better talent decisions. Our IP-driven tools and services are being utilized by our clients for everything from organizational development and job profiling to selection, training, individual and team development, succession planning, M&A, D&I, digital transformation and more.
Enhancements to our Talent Hub platform, including Korn Ferry Listen, Assess, Perform and Pay, will allow us to embed analytics directly into our clients’ user experience, providing actionable insights. In fiscal 2019, we collaborated with experience management (XM) software leader Qualtrics, whereby Korn Ferry is building a global delivery and advisory service to improve employee experience programs at scale.
New Offerings—More than 63,000 consumers have registered and are using Korn Ferry Advance, our new business-to-consumer offering, since it launched in the United States (the “U.S.”) in July 2017. We are expanding and enhancing the offering to provide more focused assistance to people looking to make their next career move, as well as to provide tailored career services to an organization’s people. Korn Ferry Advance will continue to leverage cutting-edge technology as well as the greatest asset we have—our consultants. Korn Ferry Advance is also being used to augment our Korn Ferry Advisory offerings, primarily in Leadership Development and Coaching.
Create the Top-of-Mind Brand in Organizational Consulting
Next to our people, the Korn Ferry brand is the strongest asset of the Company. Positioning Korn Ferry as the preeminent global organizational consultancy and demonstrating our ability to drive business performance through people remains the goal of our global marketing program.
The Korn Ferry brand is brought to market via two distinct channels: business-to-business (“B2B”) and business-to-consumer (“B2C”). In both instances, we communicate key core values about what we do, expressing that we are ‘more than’ as well as inspiring action in the way our customers run their businesses and in the way they approach their careers. We are executing against our strategy with these priorities in mind:
|
|
▪ |
One Korn Ferry—We will partner with internal and external stakeholders to advance a differentiated one Korn Ferry story and brand that minimizes operational risks, engages our employees, resonates in the broader market and becomes a platform for differentiation and sustainable growth. |
|
|
▪ |
Generate Demand—We will assess market trends, liaise with clients, and partner with internal stakeholders to develop a steady cadence of thought leadership-based, campaigns, public relations and demand generation activities that engage clients and prospects in meaningful conversations. |
Advance Korn Ferry as a Premier Career Destination
We continue to invest in building a world-class organization that is aligned to our strategy and is staffed by a capable, motivated and agile workforce. A few key initiatives in this area include:
|
|
▪ |
Onboarding—In fiscal 2019, we increased our headcount by 1,035. To support this growth, we have launched a standardized, global onboarding experience for all Korn Ferry new hires using a common platform, materials and resources to ensure all new hires are effectively integrated into the Company with reduced ramp-up time to full productivity. We are also taking a programmatic approach to onboarding through our Talent Academy and StartUp early career cohort trainings. |
|
|
▪ |
Career Paths and Mobility—Under the Korn Ferry enterprise-wide career model, we are defining and will roll out career paths that enable and encourage talent mobility across all areas of our business along with self-directed development. In fiscal 2019, we promoted more than 800 colleagues across our three segments. |
|
|
▪ |
Talent Development—Our growth plans require a learning, agile organization. To facilitate this, we use a learning management system (iAcademy) to serve as a Center of Excellence focused on the growth and development of our colleagues through rich, personalized content. |
|
|
▪ |
Mentoring—As our firm continues to expand in size and offerings, our colleagues face increasingly complex client and career issues, all while learning how to work together as One Korn Ferry. The need to connect, collaborate and help each other has never been more pronounced. In the year ahead, we will roll out a firm-wide mentorship program to empower our colleagues to learn, connect and advance. Paired through the Korn Ferry Advance platform, Mentors and Mentees will be matched based on proximity and career goals and focus. |
|
|
▪ |
Benefits—We are nearing completion of our global benefits harmonization work. We are setting our sights on the next phase of our benefits strategy, which is the modernization and optimization of our benefits programs around the world. We will ensure we have benefits that are culturally relevant, market prevalent and personally impactful. We create balance between cost effectiveness and competitiveness to align with our financial goals and talent strategy. |
5
Pursue Transformational Opportunities at the Intersection of Talent and Strategy
We have developed a core competency in identifying, acquiring and integrating M&A targets that have the potential to further our strategic objectives and enhance shareholder value. Our disciplined approach to M&A will continue to play a critical role in the ongoing evolution of Korn Ferry into an industry specialized, business outcomes oriented solutions provider at the intersection of talent and strategy. While we will continue to execute on our targeted organic growth pathways, M&A will be a vital component of our future growth and capital deployment strategies.
OUR ORGANIZATION
The Company operates through its three global segments: Executive Search, Advisory, and RPO & Professional Search. Our Executive Search business is managed and reported on a geographic basis throughout four regions: North America, Europe, the Middle East and Africa (“EMEA”), Asia Pacific and Latin America. Advisory and RPO & Professional Search are managed on a global basis with operations in North America, EMEA, Asia Pacific and Latin America.
Executive Search
Overview—Korn Ferry helps clients attract and hire leaders who fit with their organization and make it stand out. Our services are typically used to fill executive-level positions, such as board directors, chief executive officers, chief financial officers, chief operating officers, chief information officers, chief human resource officers and other senior executive officers.
Our Executive Search services concentrate on searches for positions with average annual cash compensation of $360,000 or more, or comparable compensation in foreign locations. The industry is comprised of retained and contingency recruitment firms. Retained firms, such as Korn Ferry, typically charge a fee for their services equal to approximately one-third of the first-year annual cash compensation for the position being filled regardless of whether the position is filled. Contingency firms generally work on a non-exclusive basis and are compensated only upon successfully placing a recommended candidate.
As part of being retained by a client to conduct a search, we assemble a team of consultants with appropriate geographic, industry and functional expertise. We utilize a standardized and differentiated approach to placing talent that integrates our research-based IP with our practical experience. Our search consultants serve as management advisors who work closely with the client in identifying, assessing and placing qualified candidates. In fiscal 2019, we executed 6,790 new executive search assignments.
Industry Specialization—Consultants in our six industries bring an in-depth understanding of the market conditions and strategic management issues faced by clients within their specific industries and geographies. We are continually looking to expand our specialized expertise through internal development and strategic hiring in targeted growth areas.
Percentage of Fiscal 2019 Assignments Opened by Industry Specialization
|
Global Industries: |
|
|
|
|
|
Industrial |
|
|
31 |
% |
|
Financial Services |
|
|
20 |
% |
|
Life Sciences/Healthcare Provider |
|
|
16 |
% |
|
Consumer |
|
|
15 |
% |
|
Technology |
|
|
13 |
% |
|
Regional Specialties (United States): |
|
|
|
|
|
Education/Not-for-Profit |
|
|
5 |
% |
Functional Expertise—We have organized executive search centers of functional expertise, composed of consultants who have extensive backgrounds in placing executives in certain functions, such as board directors, CEOs and other senior executive officers. Our Board & CEO Services group, for example, focuses exclusively on placing CEOs and board directors in organizations around the world. This is a dedicated team from the most senior ranks of the Company. Their work is with CEOs and in the boardroom, and their expertise is organizational leadership and governance. They conduct hundreds of engagements every year, tapping talent from every corner of the globe. This work spans all ranges of organizational scale and purpose. Members of functional groups are located throughout our regions and across our industry groups.
6
Percentage of Fiscal 2019 Assignments Opened by Functional Expertise
|
Board Level/CEO/CFO/Senior Executive and General Management |
|
|
71 |
% |
|
Finance and Control |
|
|
9 |
% |
|
Marketing and Sales |
|
|
6 |
% |
|
Information Systems |
|
|
5 |
% |
|
Manufacturing/Engineering/Research and Development/Technology |
|
|
5 |
% |
|
Human Resources and Administration |
|
|
4 |
% |
Regions
North America—As of April 30, 2019, we had operations in 19 cities throughout the United States and Canada. In fiscal 2019, the region generated fee revenue of $455.8 million and opened 2,901 new engagements with an average of 256 consultants.
EMEA—As of April 30, 2019, we had operations in 23 cities in 20 countries throughout the region. In fiscal 2019, the region generated fee revenue of $182.8 million and opened 2,011 new engagements with an average of 166 consultants.
Asia Pacific—As of April 30, 2019, we had operations in 18 cities in 10 countries throughout the region. In fiscal 2019, the region generated fee revenue of $104.3 million and opened 1,303 new engagements with an average of 96 consultants.
Latin America—As of April 30, 2019, we had operations in 9 cities in 7 countries covering the entire Latin America region. In fiscal 2019, the region generated fee revenue of $31.9 million and opened 575 new engagements with an average of 36 consultants.
Client Base—Our 3,993 Search engagement clients in fiscal 2019 include many of the world’s largest and most prestigious public and private companies.
Competition—In Executive Search, we compete with other global executive search firms. Although these firms are our largest competitors, we also compete with smaller boutique firms that specialize in specific regional, industry or functional searches. We believe our brand name, differentiated business model, systematic approach to client service, cutting-edge technology, unique IP, global network, prestigious clientele, strong specialty practices and high-caliber colleagues are recognized worldwide. We also believe our long-term incentive compensation arrangements, as well as other executive benefits, distinguish us from most of our competitors and are important in attracting and retaining our key consultants.
Advisory
Overview—Korn Ferry helps clients design their organization—the structure, roles and responsibilities—and shows them the best way to compensate, develop and motivate their people. Our focus is on making change happen and helping people and organizations exceed their potential. Through our talented colleagues, robust solutions and intellectual property, our consultants are able to solve the most disruptive and challenging organizational and talent problems facing clients.
Our Advisory team is comprised of top leadership and organizational advisory consultants and thought leaders, working in 85 cities in 49 countries. Our consultants are predominately recruited from local markets, so they are sensitive to local issues, but work together in global teams, resulting in larger opportunities with greater client and commercial impact.
We are an advisory leader and many of the world’s most admired organizations choose to partner with us because of our track record delivering successful outcomes, our ability to listen, and our focus on putting our clients first. We accomplish this through a combination of solution, consulting and other products that address how people work and show how to nurture them so that their strategies succeed. We capitalize on the breadth of our IP, service offerings and expertise to do what is right for the client—transforming ideas into actionable insights. Clients can depend on our products and platforms to be data backed, market tested and agile.
Korn Ferry is known for creating and owning one of the richest and most comprehensive people and pay data sets in the world, including the most widely used job evaluation methodology. We have helped clients assess and develop hundreds of thousands of managers and executives. In addition, we have built a database of organizational management information that enables our clients to benchmark themselves against the best performers in their industries on any multitude of dimensions.
7
Within Advisory, we offer the following core go-to-market solutions:
Organizational Strategy: We provide end-to-end support to organizations that want to transform their business. Strategy becomes operationalized by aligning the tangible elements of the organization—people, structure and process—and the intangible elements—motivations, relationships and culture.
Assessment and Succession: We provide actionable, research-backed insight and products that allow organizations to understand the talent they have, benchmarked against the talent they need to deliver on the business strategy, and we help them close any gaps.
Leadership Development: We develop leaders at every stage of the leadership journey, from first time manager to CEO, with a spectrum of high-touch and high-tech leadership development experiences that are tightly aligned with succession and talent processes. Our solutions are backed by tools and techniques that are delivered by hundreds of dedicated leadership development experts across the globe.
Rewards and Benefits: We help organizations design rewards to achieve their strategic objectives, to pay their people fairly for doing the right things—with rewards they value—at a cost the organization can afford. Our advice is backed by the quality and quantity of our pay data and widely used job evaluation methodology.
These solutions are often bundled into integrated market offerings (e.g., Digital Transformation, M&A) that integrate our best thinking across our solutions, enabling us to develop innovative and differentiated approaches to our clients’ most pressing business challenges.
These solutions are also enhanced, enabled and optimized through various products, allowing clients to resolve people challenges consistently and cost effectively. Some are delivered by our accredited experts; others through our powerful digital tools.
Consulting fee revenue was $568.3 million, $540.5 million and $497.7 million in fiscal 2019, 2018 and 2017, respectively. This represented 30%, 31% and 32% of the Company’s total fee revenue in fiscal 2019, 2018 and 2017, respectively.
Products fee revenue was $252.7 million, $244.5 million and $226.5 million in fiscal 2019, 2018 and 2017, respectively.
Regions—As of April 30, 2019, we had Advisory operations in 23 cities in North America, 33 in EMEA, 20 in Asia Pacific, and 9 in Latin America.
Client Base—During fiscal 2019, the Advisory segment partnered with approximately 10,000 clients across the globe and 15% of Advisory’s fiscal 2019 fee revenue was referred from Korn Ferry’s Executive Search and RPO & Professional Search segments. Our clients come from the private, public and not-for-profit sectors, across every major industry and represent diverse business challenges.
Competition—The people and organizational consulting market is extremely competitive, as companies are increasingly seeking ways to synchronize their strategy and talent to drive superior business performance. Our competitors include consulting organizations affiliated with accounting, insurance, information systems, executive search and staffing firms, as well as strategy consulting firms. Although these firms are our largest competitors, we also compete with smaller boutique firms that specialize in specific regional, industry or functional aspects of leadership and HR consulting.
Successful strategy implementation is 90% about execution, and successful execution is 90% about getting the people, organization and cultural aspects right. This is where we have an edge over our competition. We focus on making change happen. In a world of constant disruption, it is critical that we build our clients’ capability to keep on changing—embedding it into every consulting project.
We also believe our products and IP, utilized every day and embedded into the core business processes of the world’s most admired companies, are a major competitive differentiator.
RPO & Professional Search
Overview—Korn Ferry combines people, process expertise and IP enabled technology to deliver enterprise talent acquisition solutions to our clients. Our recruiting solutions have breadth, including all functional talent segments—IT, Marketing, R&D, Commercial Sales, HR, Supply Chain, Finance and Legal. We also have depth, with the ability to deliver transaction sizes ranging from single professional searches to team, department and line of business projects, and enterprise global professional recruiting solutions. Our global capabilities deliver 1-10,000 or more new hires to address our clients’ employment needs.
8
RPO: In fiscal 2019, Korn Ferry was recognized as a top five RPO provider in the Baker’s Dozen list, marking our 12th consecutive year on the list. Through decades of experience, we have enhanced our RPO solution to deliver quality candidates that drive our clients’ business strategies. We leverage proprietary IP and data sets to guide clients on the critical skills and competencies to look for, compensation Information to align with market demand, and assessment tools to ensure candidate fit.
We combine traditional recruitment expertise with a multi-tiered portfolio of talent acquisition solutions. Consultants, based in 30 countries, have access to our databases of pre-screened, mid-level professionals. Our global candidate pool complements our international presence and multi-channel sourcing strategy to provide speed, efficiency and quality service for clients worldwide.
Project Recruitment: We are able to deliver the same talent acquisition services as we would in an end-to-end RPO solution, but within a defined project start and end date. Our Project Recruitment solution is seamless and aligned with the client’s broader talent acquisition strategy. Clients enjoy the same benefits around reduced time to hire, reduced cost per hire and improved candidate quality that they would with a full RPO solution, but via an on-demand model to manage short-term or specialized needs.
Professional Search: We are positioned to help organizations identify and attract professionals at the middle to upper levels of management in single-search engagements. We focus on:
|
INDUSTRIES: ▪ Consumer |
FUNCTIONAL EXPERTISE: ▪ Finance & Accounting |
|
▪ Financial Services |
▪ Human Resources |
|
▪ Industrial |
▪ Information Technology |
|
▪ Life Sciences/Healthcare |
▪ Sales, Marketing & Digital |
|
▪ Technology |
▪ Supply Chain Management |
|
▪ Education/Not-for-Profit |
|
Our innovative search process mirrors our Executive Search solution, offering access to active and passive candidate pools, the industry’s richest data on salaries and employee engagement, and proprietary tools such as Four Dimensional Executive Assessment and Executive Snapshot. A wealth of assessment data defines the traits needed for success in each role we recruit and matches candidates against best-in-class profiles while also gauging cultural fit.
Regions—As of April 30, 2019, we had RPO & Professional Search operations in 13 cities in North America, 13 in EMEA, 18 in Asia Pacific, and 9 in Latin America.
Client Base—During fiscal 2019, the RPO & Professional Search segment partnered with 2,093 clients across the globe and 44% of RPO & Professional Search’s fiscal 2019 fee revenue was referred from Korn Ferry’s Executive Search and Advisory segments.
Competition—We primarily compete for RPO business with other global RPO providers and compete for search assignments with regional contingency recruitment firms and large national retained recruitment firms. We believe our competitive advantage is distinct. We are strategic, working with clients to hire best-fit candidates using our assessment IP, proprietary technology and professional recruiters. We also work under the One Korn Ferry umbrella to help clients plan for their broader talent acquisition needs as part of their business strategy planning.
Professional Staff and Employees
We have assembled a wealth of talent that is rewarded based on performance. Our Company brings together a wide range of disciplines and professions—everything from academic research and technology development to executive recruiting, consulting, and business leadership. We are also a culturally diverse organization. Our people come from all over the world and speak a multitude of languages. For us, this diversity is a key source of strength. It means we have people who are able to challenge convention, offer unique perspectives, and generate innovative ideas. Equally important, it means we can think and act globally—just like our clients.
As of April 30, 2019, we had a total of 8,678 full-time employees. Of this, 1,960 were Executive Search employees consisting of 565 consultants and 1,395 associates, researchers, administrative and support staff. Our Advisory segment had 3,603 employees as of April 30, 2019, consisting of 579 consultants and 3,024 associates, researchers, administrative and support staff. Our RPO & Professional Search segment had 2,942 employees as of April 30, 2019, consisting of 304 consultants and 2,638 administrative and support staff. Corporate had 173 professionals as of April 30, 2019. We are not party to a collective bargaining agreement and consider our relations with our employees to be good. Korn Ferry is an equal opportunity employer.
9
The risks described below are the material risks facing our Company. Additional risks not presently known to us or that we currently deem immaterial may also impair our business operations. Our business, financial condition or results of operations could be materially adversely affected by any of these risks.
Competition in our industries could result in our losing market share and/or require us to charge lower prices for services, which could reduce our revenue.
While we are continuing to evolve to One Korn Ferry integrated approach in an effort to better compete in the market, we continue to face significant competition to each of our services offerings. The human resource consulting market has been traditionally fragmented and a number of large consulting firms, such as Ernst & Young, McKinsey, Willis Towers Watson and Deloitte are building businesses in human resource management consulting to serve these needs. Our advisory business line continues to face competition from human resource consulting businesses. Many of these competitors are significantly larger than Korn Ferry and have considerable resources at their disposal, allowing for potentially significant investment to grow their human resource consulting business. Increased competition, whether as a result of professional and social networking website providers, traditional executive search firms, sole proprietors and in-house human resource professionals (as noted above) or larger consulting firms building human resources consulting businesses, may lead to pricing pressures that could negatively impact our business. For example, increased competition could require us to charge lower prices, and/or cause us to lose market share, each of which could reduce our fee revenue.
Our executive search services face competition from both traditional and non-traditional competitors that provide job placement services, including other large global executive search firms, smaller specialty firms and web-based firms. In recent years, we have also begun facing increased competition from sole proprietors and in-house human resource professionals whose ability to provide job placement services has been enhanced by professional profiles made available on the internet and enhanced social media-based search tools. The continued growth of the shared economy and related freelancing platform sites may also negatively impact demand for our services by allowing employers seeking services to connect with employees in real time and without any significant cost. Traditional executive search competitors include Egon Zehnder, Heidrick & Struggles International, Inc., Russell Reynolds Associates and Spencer Stuart. In each of our markets, one or more of our competitors may possess greater resources, greater name recognition, lower overhead or other costs and longer operating histories than we do, which may give them an advantage in obtaining future clients, capitalizing on new technology and attracting qualified professionals in these markets. Additionally, specialty firms can focus on regional or functional markets or on particular industries and executive search firms that have a smaller client base may be subject to fewer off-limits arrangements. There are no extensive barriers to entry into the executive search industry and new recruiting firms continue to enter the market.
We believe the continuing development and increased availability of information technology will continue to attract new competitors, especially web-enabled professional and social networking website providers, and these providers may be facilitating a company’s ability to insource their recruiting capabilities. Competitors in these fields include SmashFly, iCIMS, Yello, Indeed, Google for Jobs and Jobvite. As these providers continue to evolve, they may develop offerings similar to or more expansive than ours, thereby increasing competition for our services or more broadly causing disruption in the executive search industry. Further, as technology continues to develop and the shared economy continues to grow, we expect that the use of freelancing platform sites will become more prevalent. As a result, companies may turn to such sites for their talent needs, which could negatively impact demand for the services we offer.
Our RPO & Professional Search services primarily competes for business with other RPO providers such as Cielo, Alexander Mann Solutions, Kenexa, Spherion, and Kelly Services, and competes for mid-level professional search assignments with regional contingency recruitment firms and large national retained recruitment firms. In addition, some organizations have developed or may develop internal solutions to address talent acquisition that may be competitive with our solutions. This is a highly competitive and developing industry with numerous specialists. To compete successfully and achieve our growth targets for our talent acquisition business, we must continue to support and develop assessment and analytics solutions, maintain and grow our proprietary database, deliver demonstrable return on investment to clients, support our products and services globally, and continue to provide consulting and training to support our assessment products. Our failure to compete effectively with our competitors could adversely affect our operating results and future growth.
Consolidation in the industries that we serve could harm our business.
Companies in the industries that we serve may seek to achieve economies of scale and other synergies by combining with or acquiring other companies. If two or more of our clients merge or consolidate and combine their operations, we may experience a decrease in the amount of services we perform for these clients. If one of our clients merges or consolidates with a company that relies on another provider for its services, we may lose work from
10
that client or lose the opportunity to gain additional work. The increased market power of larger companies could also increase pricing and competitive pressures on us. Any of these possible results of industry consolidation could harm our business, results of operations and financial condition.
If we fail to attract and retain qualified and experienced consultants, our revenue could decline and our business could be harmed.
We compete with other executive and professional search and consulting firms for qualified and experienced consultants. These other firms may be able to offer greater compensation and benefits or more attractive lifestyle choices, career paths or geographic locations than we do. Attracting and retaining consultants in our industry is particularly important because, generally, a small number of consultants have primary responsibility for a client relationship. Because client responsibility is so concentrated, the loss of key consultants may lead to the loss of client relationships. In fiscal 2019, for example, our top three Executive Search and Advisory consultants had primary responsibility for generating business equal to approximately 1% and 2% of our fee revenues, respectively, and our top ten Executive Search and Advisory consultants had primary responsibility for generating business equal to approximately 2% and 5% of our fee revenues, respectively. This risk is heightened due to the general portability of a consultant’s business: consultants have in the past, and will in the future, terminate their employment with our Company. Any decrease in the quality of our reputation, reduction in our compensation levels relative to our peers or restructuring of our compensation program, whether as a result of insufficient revenue, a decline in the market price of our common stock or for any other reason, could impair our ability to retain existing consultants or attract additional qualified consultants with the requisite experience, skills and established client relationships. Our failure to retain our most productive consultants, whether in Executive Search, Advisory or RPO & Professional Search, or maintain the quality of service to which our clients are accustomed, as well as the ability of a departing consultant to move business to his or her new employer, could result in a loss of clients, which could in turn cause our fee revenue to decline and our business to be harmed. We may also lose clients if the departing Executive Search, Advisory or RPO & Professional Search consultant has widespread name recognition or a reputation as a specialist in his or her line of business in a specific industry or management function. We could also lose additional consultants if they choose to join the departing Executive Search, Advisory or RPO & Professional Search consultant at another executive search or consulting firm. If we fail to limit departing consultants from moving business or recruiting our consultants to a competitor, our business, financial condition and results of operations could be adversely affected.
We may be limited in our ability to recruit candidates from our clients, and we could lose search opportunities to our competition, which could harm our business.
Either by agreement with clients, or for client relations or marketing purposes, we sometimes refrain from, for a specified period of time, recruiting candidates from a client when conducting searches on behalf of other clients. These off-limit agreements can generally remain in effect for up to two years following the completion of an assignment. The duration and scope of the off-limit agreement, including whether it covers all operations of the client and its affiliates or only certain divisions of a client, generally are subject to negotiation or internal policies and may depend on factors such as the scope, size and complexity of the client’s business, the length of the client relationship and the frequency with which we have been engaged to perform executive and professional searches for the client. If a prospective client believes that we are overly restricted by these off-limit agreements from recruiting employees of our existing clients, these prospective clients may not engage us to perform their executive searches. Therefore, our inability to recruit candidates from these clients may make it difficult for us to obtain search assignments from, or to fulfill search assignments for, other companies in that client’s industry. We cannot ensure that off-limit agreements will not impede our growth or our ability to attract and serve new clients, or otherwise harm our business.
We incur substantial costs to hire and retain our professionals, and we expect these costs to continue and to grow.
Our success depends on attracting and retaining professional employees. To attract and retain such employees in a competitive marketplace, we must provide a competitive compensation package. As such, we may pay hiring bonuses and annual retention bonuses to secure the services of new hires and retain our professional employees. Such payments have taken the form of long-term deferred compensation, restricted stock, and unsecured cash payments in the form of promissory notes. The aggregate amount of these awards to employees is significant and as competition in our industry intensifies, we expect to continue issuing these types of long-term incentive awards. If the national or global economy and/or labor markets were to deteriorate in the future, such changes would put negative pressure on demand for our services, thereby negatively affecting our generation of future revenues, but we would continue to incur the cost of these long-term awards, resulting in lower results of operations.
If we are unable to retain our executive officers and key personnel or integrate new members of our senior management who are critical to our business, we may not be able to successfully manage our business in the future.
Our future success depends upon the continued service of our executive officers and other key management personnel. Competition for qualified personnel is intense, and we may compete with other companies that have greater financial and other resources than we do. If we lose the services of one or more of our executives or key
11
employees, or if one or more of them decides to join a competitor or otherwise compete directly or indirectly with us, or if we are unable to integrate new members of our senior management who are critical to our business, we may not be able to successfully manage our business or achieve our business objectives.
If we are unable to maintain our professional reputation and brand name, our business will be harmed.
We depend on our overall reputation and brand name recognition to secure new engagements and to hire qualified professionals. Our success also depends on the individual reputations of our professionals. We obtain a majority of our new engagements from existing clients or from referrals by those clients. Any client who is dissatisfied with our services can adversely affect our ability to secure new engagements.
If any factor, including poor performance or negative publicity, whether or not true, hurts our reputation, we may experience difficulties in competing successfully for both new engagements and qualified consultants. Failing to maintain our professional reputation and the goodwill associated with our brand name could seriously harm our business.
As we develop new services, clients and practices, enter new lines of business, and focus more of our business on providing a full range of client solutions, the demands on our business and our operating risks may increase.
As part of our corporate strategy, we are attempting to leverage our research and advisory services to sell a full range of services across the life cycle of a policy, program, project or initiative, and we are regularly searching for ways to provide new services to clients. This strategy, even if effectively executed, may prove insufficient in light of changes in market conditions, technology, competitive pressures or other external factors. In addition, we plan to extend our services to new clients, into new lines of business, and into new geographic locations. As we focus on developing new services, clients, practice areas and lines of business; open new offices; and engage in business in new geographic locations, our operations may be exposed to additional as well as enhanced risks.
In particular, our growth efforts place substantial additional demands on our management and staff, as well as on our information, financial, administrative and operational systems. We may not be able to manage these demands successfully. Growth may require increased recruiting efforts, opening new offices, increased business development, selling, marketing and other actions that are expensive and entail increased risk. We may need to invest more in our people and systems, controls, compliance efforts, policies and procedures than we anticipate. Therefore, even if we do grow, the demands on our people and systems, controls, compliance efforts, policies and procedures may exceed the benefits of such growth, and our operating results may suffer, at least in the short-term, and perhaps in the long-term.
Efforts involving a different focus, new services, new clients, new practice areas, new lines of business, new offices and new geographic locations entail inherent risks associated with our inexperience and competition from mature participants in those areas. Our inexperience may result in costly decisions that could harm our profit and operating results. In particular, new or improved services often relate to the development, implementation and improvement of critical infrastructure or operating systems that our clients may view as “mission critical,” and if we fail to satisfy the needs of our clients in providing these services, our clients could incur significant costs and losses for which they could seek compensation from us. As our business continues to evolve and we provide a wider range of services, we will become increasingly dependent upon our employees, particularly those operating in business environments less familiar to us. Failure to identify, hire, train and retain talented employees who share our values could have a negative effect on our reputation and our business. Finally, even if effectively executed, our strategy may prove insufficient in light of changes in market conditions, technology competitive pressures or other external factors.
Our rebranding plan may take a significant amount of time, involve substantial costs and may not be favorably received by our clients.
On June 12, 2018, the Company’s Board of Directors approved a rebranding Plan for the Company. This Plan includes going to market under a single, master brand architecture, solely as Korn Ferry, and sunsetting of all the Company’s sub-brands, including Futurestep, Hay Group and Lominger, among others. The Company is harmonizing under one brand to help accelerate the firm’s positioning as the preeminent organizational consultancy and bring more client awareness to its broad range of talent management solutions
We may incur substantial costs as a result of rebranding our products and services and may not be able to achieve or maintain brand name recognition or status that is comparable to the recognition and status previously enjoyed by certain of our sub-brands. The failure of our rebranding initiatives could adversely affect our ability to attract and retain clients, which could cause us not to realize some or all of the anticipated benefits contemplated by the rebranding.
12
We are subject to potential legal liability from clients, employees, candidates for employment, stockholders and others. Insurance coverage may not be available to cover all of our potential liability and available coverage may not be sufficient to cover all claims that we may incur.
We are exposed to potential claims with respect to the executive search process and the consulting services performed by Advisory. For example, a client could assert a claim for matters such as breach of an off-limit agreement or recommending a candidate who subsequently proves to be unsuitable for the position filled. Further, the current employer of a candidate whom we placed could file a claim against us alleging interference with an employment contract; a candidate could assert an action against us for failure to maintain the confidentiality of the candidate’s employment search; and a candidate or employee could assert an action against us for alleged discrimination, violations of labor and employment law or other matters. Also, in various countries, we are subject to data protection laws impacting the processing of candidate information and other regulatory requirements that could give rise to liabilities/claims. Client dissatisfaction with the consulting services provided by our Advisory consultants may also lead to claims against us.
Additionally, as part of our Advisory services, we often send a team of leadership consultants to our clients’ workplaces. Such consultants generally have access to client information systems and confidential information. An inherent risk of such activity includes possible claims of misuse or misappropriation of client IP, confidential information, funds or other property, as well as harassment, criminal activity, torts, or other claims. Such claims may result in negative publicity, injunctive relief, criminal investigations and/or charges, payment by us of monetary damages or fines, or other material adverse effects on our business.
From time to time, we may also be subject to legal actions or claims brought by our stockholders, including securities, derivative and class actions, for a variety of matters related to our operations, such as significant business transactions, cybersecurity incidents, volatility in our stock, and our responses to stockholder activism, among others. Such actions or claims and their resolution may result in defense costs, as well as settlements, fines or judgments against us, some of which are not, or cannot be, covered by insurance. The payment of any such costs, settlements, fines or judgments that are not insured could have a material adverse effect on our business. In addition, such matters may affect the availability or cost of some of our insurance coverage, which could adversely impact our results of operations and expose us to increased risks that would be uninsured.
We cannot ensure that our insurance will cover all claims or that insurance coverage will be available at economically acceptable rates. Our ability to obtain insurance, its coverage levels, deductibles and premiums, are all dependent on market factors, our loss history and insurers’ perception of our overall risk profile. Our insurance may also require us to meet a deductible. Significant uninsured liabilities could have a material adverse effect on our business, financial condition and results of operations.
We may not be able to align our cost structure with our revenue level, which in turn may require additional financing in the future that may not be available at all or may be available only on unfavorable terms.
We continuously evaluate our cost base in relation to projected near to mid-term demand for our services in an effort to align our cost structure with the current realities of our markets. If actual or projected fee revenues are negatively impacted by weakening customer demand, we may find it necessary to take cost cutting measures so that we can minimize the impact on our profitability. There is, however, no guarantee that if we do take such measures that such measures will properly align our cost structure to our revenue level. Any failure to maintain a balance between our cost structure and our revenue could adversely affect our business, financial condition, and results of operations and lead to negative cash flows, which in turn might require us to obtain additional financing to meet our capital needs. If we are unable to secure such additional financing on favorable terms, or at all, our ability to fund our operations could be impaired, which could have a material adverse effect on our results of operations.
Our financial results could suffer if we are unable to achieve or maintain adequate utilization and suitable billing rates for our consultants.
Our profitability depends, to a large extent, on the utilization and billing rates of our professionals. Utilization of our professionals is affected by a number of factors, including:
|
|
▪ |
the number and size of client engagements; |
|
|
▪ |
the timing of the commencement, completion and termination of engagements (for example, the commencement or termination of multiple RPO engagements could have a significant impact on our business, including significant fluctuations in our fee revenue, since these types of engagements are generally larger, in terms of both staffing and fee revenue generated, than our other engagements); |
|
|
▪ |
our ability to transition our consultants efficiently from completed engagements to new engagements; |
13
|
|
▪ |
the hiring of additional consultants because there is generally a transition period for new consultants that results in a temporary drop in our utilization rate; |
|
|
▪ |
unanticipated changes in the scope of client engagements; |
|
|
▪ |
our ability to forecast demand for our services and thereby maintain an appropriate level of consultants; and |
|
|
▪ |
conditions affecting the industries in which we practice as well as general economic conditions. |
The billing rates of our consultants that we are able to charge are also affected by a number of factors, including:
|
|
▪ |
our clients’ perception of our ability to add value through our services; |
|
|
▪ |
the market demand for the services we provide; |
|
|
▪ |
an increase in the number of clients in the government sector in the industries we serve; |
|
|
▪ |
the introduction of new services by us or our competitors; |
|
|
▪ |
our competition and the pricing policies of our competitors; and |
|
|
▪ |
current economic conditions. |
If we are unable to achieve and maintain adequate overall utilization, as well as maintain or increase the billing rates for our consultants, our financial results could materially suffer. In addition, our consultants oftentimes perform services at the physical locations of our clients. If there are natural disasters, disruptions to travel and transportation or problems with communications systems, our ability to perform services for, and interact with, our clients at their physical locations may be negatively impacted, which could have an adverse effect on our business and results of operations.
The profitability of our fixed-fee engagements with clients may not meet our expectations if we underestimate the cost of these engagements when pricing them.
When making proposals for fixed-fee engagements, we estimate the costs and timing for completing the engagements. These estimates reflect our best judgment regarding the efficiencies of our methodologies and consultants as we plan to deploy them on engagements. Any increased or unexpected costs or unanticipated delays in connection with the performance of fixed-fee engagements, including delays caused by factors outside our control, could make these contracts less profitable or unprofitable, which would have an adverse effect on our profit margin. For the years ended April 30, 2019, 2018, and 2017, fixed-fee engagements represented 27%, 28%, and 29% of our revenues, respectively.
Changes in our accounting estimates and assumptions could negatively affect our financial position and results of operations.
We prepare our consolidated financial statements in accordance with U.S. generally accepted accounting principles (“GAAP”). These accounting principles require us to make estimates and assumptions that affect the reported amounts of assets and liabilities and the disclosure of contingent assets and liabilities at the date of our financial statements. We are also required to make certain judgments that affect the reported amounts of revenues and expenses during each reporting period. We periodically evaluate our estimates and assumptions including those relating to revenue recognition, restructuring, deferred compensation, goodwill and other intangible assets, contingent consideration, annual performance-related bonuses, allowance for doubtful accounts, share-based payments and deferred income taxes. Actual results could differ from the estimates we make based on historical experience and various assumptions believed to be reasonable based on specific circumstances, and changes in accounting standards could have an adverse impact on our future financial position and results of operations.
Foreign currency exchange rate risks may adversely affect our results of operations.
A material portion of our revenue and expenses are generated by our operations in foreign countries, and we expect that our foreign operations will account for a material portion of our revenue and expenses in the future. Most of our international expenses and revenue are denominated in foreign currencies. As a result, our financial results could be affected by changes in foreign currency exchange rates or weak economic conditions in foreign markets in which we have operations, among other factors. Fluctuations in the value of those currencies in relation to the U.S. dollar have caused and will continue to cause dollar-translated amounts to vary from one period to another. Given the volatility of exchange rates, we may not be able to manage effectively our currency translation or transaction risks, which may adversely affect our financial condition and results of operations.
14
Unfavorable tax laws, tax law changes and tax authority rulings may adversely affect results.
We are subject to income taxes in the U.S. and in various foreign jurisdictions. Domestic and international tax liabilities are subject to the allocation of income among various tax jurisdictions. Our effective tax rate could be adversely affected by changes in the mix of earnings among countries with differing statutory tax rates or changes in tax laws. The amount of income taxes and other taxes are subject to ongoing audits by U.S. federal, state and local tax authorities and by non-U.S. authorities. If these audits result in assessments different from estimated amounts recorded, future financial results may include unfavorable tax adjustments.
Future changes in tax laws, treaties or regulations, and their interpretations or enforcement, may be unpredictable, particularly as taxing jurisdictions face an increasing number of political, budgetary and other fiscal challenges. Tax rates in the jurisdictions in which we operate may change as a result of macroeconomic and other factors outside of our control, making it increasingly difficult for multinational corporations like ourselves to operate with certainty about taxation in many jurisdictions. As a result, we could be materially adversely affected by future changes in tax law or policy (or in their interpretation or enforcement) in the jurisdictions where we operate, including the United States, which could have a material adverse effect on our business, cash flow, results of operations, financial condition, as well as our effective income tax rate.
Technical guidance on a broad range of topics related to the Tax Cuts and Jobs Act could have a material impact on our business and our company.
On December 22, 2017, the Tax Cuts and Jobs Act (the “Tax Act”) was enacted into law, making significant changes to the taxation of U.S. business entities. The most significant impacts of the Tax Act on the Company include (1) a reduction in the U.S. corporate federal statutory income tax rate from 35.0% to 21.0% effective January 1, 2018, and (2) a one-time tax on accumulated foreign earnings (the “Transition Tax”), which is applicable at a rate of 15.5% on cash and other specified assets and 8% on other residual earnings. We finalized our computation of the Transition Tax and remeasurement of deferred tax balances in accordance with our current understanding of the Tax Act and currently available guidance. For additional information regarding the Tax Act and the tax amounts recorded in our consolidated financial statements, see Note 8—Income Taxes. While our financial statements as of and for the year ended April 30, 2019 reflect the impact due to the Tax Act, further technical guidance on a broad range of topics related to the Tax Act is expected and may have a material adverse effect on our business, cash flow, results from operations, financial condition, as well as our effective income tax rate.
We have deferred tax assets that we may not be able to use under certain circumstances.
If we are unable to generate sufficient future taxable income in certain jurisdictions, or if there is a significant change in the time period within which the underlying temporary differences become taxable or deductible, we could be required to increase our valuation allowances against our deferred tax assets. This would result in an increase in our effective tax rate, and an adverse effect on our future operating results. In addition, changes in statutory tax rates may also change our deferred tax assets or liability balances, with either a favorable or unfavorable impact on our effective tax rate. Our deferred tax assets may also be impacted by new legislation or regulation.
Our indebtedness could impair our financial condition and reduce funds available to us for other purposes and our failure to comply with the covenants contained in our debt instruments could result in an event of default that could adversely affect our operations and financial condition.
On December 19, 2018, the Company entered into a senior secured $650.0 million Amended and Restated Credit Agreement with a syndicate of banks. As of April 30, 2019, $226.9 million was outstanding under the revolving loan.
If we do not generate sufficient cash flow from operations to satisfy our debt obligations, we may have to undertake alternative financing plans. We cannot ensure that we will be able to refinance our debt or enter into alternative financing plans in adequate amounts on commercially reasonable terms, terms acceptable to us or at all, or that such plans guarantee that we would be able to meet our debt obligations.
Our existing debt agreements contain financial and restrictive covenants that limit the total amount of debt that we may incur and may limit our ability to engage in other activities that we may believe are in our long-term best interests, including the disposition or acquisition of assets or other companies or the payment of dividends to our stockholders. Our failure to comply with these covenants may result in an event of default, which, if not cured or waived, could accelerate the maturity of our indebtedness or prevent us from accessing additional funds under our revolving credit facility. If the maturity of our indebtedness is accelerated, we may not have sufficient cash resources to satisfy our debt obligations, and we may not be able to continue our operations as planned.
The expansion of social media platforms presents new risks and challenges that can cause damage to our brand and reputation.
There has been a marked increase in the use of social media platforms, including weblogs (or blogs), social media websites and other forms of Internet-based communications, which allow individuals access to a broad audience of
15
consumers and other interested persons. The inappropriate and/or unauthorized use of such media vehicles by our clients or employees could increase our costs, cause damage to our brand, lead to litigation or result in information leakage, including the improper collection and/or dissemination of personally identifiable information of candidates and clients. In addition, negative or inaccurate posts or comments about us on any social networking platforms could damage our reputation, brand image and goodwill.
Technological advances may significantly disrupt the labor market and weaken demand for human capital at a rapid rate.
Our success is directly dependent on our customers’ demands for talent. As technology continues to evolve, more tasks currently performed by people may be replaced by automation, robotics, machine learning, artificial intelligence and other technological advances outside of our control. The human resource industry has been and continues to be impacted by significant technological changes, enabling companies to offer services competitive with ours. Many of those technological changes may (i) reduce demand for our services, (ii) enable the development of competitive products or services, or (iii) enable our current customers to reduce or bypass the use of our services, particularly in lower-skill job categories. Additionally, rapid changes in artificial intelligence and block chain-based technology are increasing the competitiveness landscape. We may not be successful in anticipating or responding to these changes and demand for our services could be further reduced by advanced technologies being deployed by our competitors. The effort to gain technological expertise and develop new technologies in our business may require us to incur significant expenses. In some cases, we depend on key vendors and partners to provide technology and other support. If these third parties fail to perform their obligations or cease to work with us, our ability to execute on our strategic initiatives could be adversely affected.
Limited protection of our intellectual property could harm our business, and we face the risk that our services or products may infringe upon the intellectual property rights of others.
We cannot guarantee that trade secrets, trademark and copyright law protections are adequate to deter misappropriation of our IP (which has become an important part of our business). Existing laws of some countries in which we provide services or products may offer only limited protection of our IP rights. Redressing infringements may consume significant management time and financial resources. Also, we may be unable to detect the unauthorized use of our IP and take the necessary steps to enforce our rights, which may have a material adverse impact on our business, financial condition or results of operations. We cannot be sure that our services and products, or the products of others that we offer to our clients, do not infringe on the IP rights of third parties, and we may have infringement claims asserted against us or our clients. These claims may harm our reputation, result in financial liability and prevent us from offering some services or products.
We have invested in specialized technology and other intellectual property for which we may fail to fully recover our investment, or which may become obsolete.
We have invested in developing specialized technology and IP, including proprietary systems, processes and methodologies, such as Searcher Express and KF Insight, that we believe provide us a competitive advantage in serving our current clients and winning new engagements. Many of our service and product offerings rely on specialized technology or IP that is subject to rapid change, and to the extent that this technology and IP is rendered obsolete and of no further use to us or our clients, our ability to continue offering these services, and grow our revenues, could be adversely affected. There is no assurance that we will be able to develop new, innovative or improved technology or IP or that our technology and IP will effectively compete with the IP developed by our competitors. If we are unable to develop new technology and IP or if our competitors develop better technology or IP, our revenues and results of operations could be adversely affected.
We rely heavily on our information systems and if we lose that technology, or fail to further develop our technology, our business could be harmed.
Our success depends in large part upon our ability to store, retrieve, process, manage and protect substantial amounts of information. To achieve our strategic objectives and to remain competitive, we must continue to develop and enhance our information systems. This may require the acquisition of equipment and software and the development of new proprietary software, either internally or through independent consultants. If we are unable to design, develop, implement and utilize, in a cost-effective manner, information systems that provide the capabilities necessary for us to compete effectively, or for any reason any interruption or loss of our information processing capabilities occurs, this could harm our business, results of operations and financial condition. We cannot be sure that our insurance against the effects of a disaster regarding our information technology or our disaster recovery procedures currently in place will continue to be available at reasonable prices, cover all our losses or compensate us for the possible loss of clients occurring during any period that we are unable to provide business services.
We are subject to risk as it relates to software that we license from third parties.
We license software from third parties, much of which is integral to our systems and our business. The licenses are generally terminable if we breach our obligations under the license agreements. If any of these relationships were terminated or if any of these parties were to cease doing business or cease to support the applications we currently
16
utilize, we may be forced to spend significant time and money to replace the licensed software. However, we cannot assure you that the necessary replacements will be available on reasonable terms, if at all.
We are increasingly dependent on third parties for the execution of critical functions.
We do not maintain all of our technology infrastructure, and we have outsourced certain other critical applications or business processes to external providers, including cloud-based services. The failure or inability to perform on the part of one or more of these critical suppliers or partners could cause significant disruptions and increased costs. We are also dependent on security measures that some of our third-party vendors and customers are taking to protect their own systems and infrastructures. If our third-party vendors do not maintain adequate security measures, do not require their sub-contractors to maintain adequate security measures, do not perform as anticipated and in accordance with contractual requirements, or become targets of cyber-attacks, we may experience operational difficulties and increased costs, which could materially and adversely affect our business.
Cyber security vulnerabilities and incidents could lead to the improper disclosure of information obtained from our clients, candidates and employees that could result in liability and harm to our reputation.
We use information technology and other computer resources to carry out operational and marketing activities and to maintain our business records. We rely on information technology systems to process, transmit, and store electronic information and to communicate among our locations around the world and with our clients, partners, and employees. The breadth and complexity of this infrastructure increases the potential risk of security breaches which could lead to potential unauthorized disclosure of confidential information.
Our systems and networks are vulnerable to computer viruses, malware, worms, hackers and other security issues, including physical and electronic break-ins, router disruption, sabotage or espionage, disruptions from unauthorized access and tampering (including through social engineering such as phishing attacks), impersonation of authorized users and coordinated denial-of-service attacks. For example, in the past we have experienced cyber security incidents resulting from unauthorized access to our systems, which to date have not had a material impact on our business or results of operations; however, there is no assurance that such impacts will not be material in the future.
The continued occurrence of high-profile data breaches against various entities and organizations provides evidence of an external environment that is increasingly hostile to information security. This environment demands that we continuously improve our design and coordination of security controls across our business groups and geographies in order to protect information that we develop or that is obtained from our clients, candidates and employees. Despite these efforts, given the ongoing and increasingly sophisticated attempts to access the information of entities, our security controls over this information, our training of employees, and other practices we follow may not prevent the improper disclosure of such information. Our efforts and the costs incurred to bolster our security against attacks cannot provide absolute assurance that future data breaches will not occur. We depend on our overall reputation and brand name recognition to secure new engagements. Perceptions that we do not adequately protect the privacy of information could inhibit attaining new engagements, qualified consultants and could potentially damage currently existing client relationships.
Data security, data privacy and data protection laws, such as the European Union General Data Protection Regulation (“GDPR”), and other evolving regulations and cross-border data transfer restrictions, may limit the use of our services, increase our costs and adversely affect our business.
We are subject to numerous U.S. and foreign jurisdiction laws and regulations designed to protect client, colleague, supplier and company data, such as the GDPR, which became effective in May 2018, and requires companies to meet stringent requirements regarding the handling of personal data, including its use, protection and transfer and the ability of persons whose data is stored to correct or delete such data about themselves. Complying with the enhanced obligations imposed by the GDPR has resulted and may continue to result in additional costs to our business and has required and may further require us to amend certain of our business practices. Failure to meet the GDPR requirements could result in significant penalties, including fines up to 4% of annual worldwide revenue. The GDPR also confers a private right of action on certain individuals and associations.
Laws and regulations in this area are evolving and generally becoming more stringent. For example, the New York State Department of Financial Services has issued cybersecurity regulations that outline a variety of required security measures for protection of data. Other U.S. states, including California and South Carolina, have also recently enacted cybersecurity laws requiring certain security measures of regulated entities that are broadly similar to GDPR requirements, and we expect that other states will continue to do so. As these laws continue to evolve, we may be required to make changes to our services, solutions and/or products so as to enable the Company and/or our clients to meet the new legal requirements, including by taking on more onerous obligations in our contracts, limiting our storage, transfer and processing of data and, in some cases, limiting our service and/or solution offerings in certain locations. Changes in these laws, or the interpretation and application thereof, may also increase our potential exposure through significantly higher potential penalties for non-compliance. The costs of compliance with, and other burdens imposed by, such laws and regulations and client demand in this area may limit the use of, or demand for, our services, solutions and/or products, make it more difficult and costly to meet client expectations, or lead to significant fines, penalties or liabilities for noncompliance, any of which could adversely affect our business, financial condition, and results of operations.
17
In addition, due to the uncertainty and potentially conflicting interpretations of these laws, it is possible that such laws and regulations may be interpreted and applied in a manner that is inconsistent from one jurisdiction to another and may conflict with other rules or our practices. Any failure or perceived failure by us to comply with applicable laws or satisfactorily protect personal information could result in governmental enforcement actions, litigation, or negative publicity, any of which could inhibit sales of our services, solutions and/or products.
Further, enforcement actions and investigations by regulatory authorities related to data security incidents and privacy violations continue to increase. It is possible that future enactment of more restrictive laws, rules or regulations and/or future enforcement actions or investigations could have an adverse impact on us through increased costs or restrictions on our businesses and noncompliance could result in regulatory penalties and significant legal liability.
Acquisitions, or our inability to effect acquisitions, may have an adverse effect on our business.
We have completed several strategic acquisitions of businesses in the last several years, including our acquisition of Hay Group in fiscal 2016. Targeted acquisitions have been part of our growth strategy, and we may in the future selectively acquire businesses that are complementary to our existing service offerings. However, we cannot be certain that we will be able to continue to identify appropriate acquisition candidates or acquire them on satisfactory terms. Our ability to consummate such acquisitions on satisfactory terms will depend on:
|
|
▪ |
the extent to which acquisition opportunities become available; |
|
|
▪ |
our success in bidding for the opportunities that do become available; |
|
|
▪ |
negotiating terms that we believe are reasonable; and |
|
|
▪ |
regulatory approval, if required. |
Our ability to make strategic acquisitions may also be conditioned on our ability to fund such acquisitions through the incurrence of debt or the issuance of equity. Our credit agreement dated as of December 19, 2018 limits us from consummating acquisitions unless we are in pro forma compliance with our financial covenants, and our pro forma domestic liquidity after giving effect to the acquisition is at least $50.0 million, and certain other conditions are met. If we are required to incur substantial indebtedness in connection with an acquisition, and the results of the acquisition are not favorable, the increased indebtedness could decrease the value of our equity. In addition, if we need to issue additional equity to consummate an acquisition, doing so would cause dilution to existing stockholders.
If we are unable to make strategic acquisitions, or the acquisitions we do make are not on terms favorable to us or not effected in a timely manner, it may impede the growth of our business, which could adversely impact our profitability and our stock price.
We have provisions that make an acquisition of us more difficult and expensive.
Anti-takeover provisions in our Certificate of Incorporation, our Bylaws and under Delaware law make it more difficult and expensive for us to be acquired in a transaction that is not approved by our Board of Directors. Some of the provisions in our Certificate of Incorporation and Bylaws include:
|
|
▪ |
limitations on stockholder actions; |
|
|
▪ |
advance notification requirements for director nominations and actions to be taken at stockholder meetings; and |
|
|
▪ |
the ability to issue one or more series of preferred stock by action of our Board of Directors. |
These provisions could discourage an acquisition attempt or other transaction in which stockholders could receive a premium over the current market price for the common stock.
We may not be able to successfully integrate or realize the expected benefits from our acquisitions.
Our future success may depend in part on our ability to complete the integration of acquisition targets successfully into our operations. The process of integrating an acquired business may subject us to a number of risks, including:
|
|
▪ |
diversion of management attention; |
|
|
▪ |
amortization of intangible assets, adversely affecting our reported results of operations; |
|
|
▪ |
inability to retain and/or integrate the management, key personnel and other employees of the acquired business; |
18
|
|
▪ |
inability to establish uniform standards, disclosure controls and procedures, internal control over financial reporting and other systems, procedures and policies in a timely manner; |
|
|
▪ |
inability to retain the acquired company’s clients; |
|
|
▪ |
exposure to legal claims for activities of the acquired business prior to acquisition; and |
|
|
▪ |
incurrence of additional expenses in connection with the integration process. |
If our acquisitions are not successfully integrated, our business, financial condition and results of operations, as well as our professional reputation, could be materially adversely affected.
Further, we cannot assure that acquisitions will result in the financial, operational or other benefits that we anticipate. Some acquisitions may not be immediately accretive to earnings and some expansion may result in significant expenditures.
Businesses we acquire may have liabilities or adverse operating issues which could harm our operating results.
Businesses we acquire may have liabilities or adverse operating issues, or both, that we either fail to discover through due diligence or underestimate prior to the consummation of the acquisition. These liabilities and/or issues may include the acquired business’ failure to comply with, or other violations of, applicable laws, rules or regulations or contractual or other obligations or liabilities. As the successor owner, we may be financially responsible for, and may suffer harm to our reputation or otherwise be adversely affected by, such liabilities and/or issues. An acquired business also may have problems with internal controls over financial reporting, which could in turn cause us to have significant deficiencies or material weaknesses in our own internal controls over financial reporting. These and any other costs, liabilities, issues, and/or disruptions associated with any past or future acquisitions, and the related integration, could harm our operating results.
As a result of our acquisitions, we have substantial amounts of goodwill and intangible assets, and changes in business conditions could cause these assets to become impaired, requiring write-downs that would adversely affect our operating results.
All of our acquisitions have been accounted for as purchases and involved purchase prices well in excess of tangible asset values, resulting in the creation of a significant amount of goodwill and other intangible assets. As of April 30, 2019, goodwill and purchased intangibles accounted for approximately 25% and 4%, respectively, of our total assets. Under U.S. GAAP, we do not amortize goodwill and intangible assets acquired in a purchase business combination that are determined to have indefinite useful lives, but instead review them annually (or more frequently if impairment indicators arise) for impairment. As discussed above, in connection with the Plan, the Company now offers substantially all of the Company’s current products and services using the “Korn Ferry” name, branding and trademarks, and has sunset substantially all sub-brands, including Futurestep, Hay Group and Lominger, among others. The Hay Group and Lominger brands came to the Company through acquisitions and, in connection with the accounting for those acquisitions, $106.6 million of the purchase price was allocated to indefinite lived tradename intangible assets. On June 12, 2018, the Company concluded that as a result of the decision to discontinue the use of such sub-brands in the near term, the Company was required under U.S. generally accepted accounting principles to record in the first quarter of fiscal 2019 a one-time, non-cash intangible asset impairment charge of $106.6 million. The discontinuation of such brands could adversely affect our business. Further, although we have to date determined that none of our other assets have been impaired, future events or changes in circumstances that result in an impairment of goodwill or other intangible assets would have a negative impact on our profitability and operating results.
An impairment in the carrying value of goodwill and other intangible assets could negatively impact our consolidated results of operations and net worth.
Goodwill is initially recorded as the excess of amounts paid over the fair value of net assets acquired. While goodwill is not amortized, it is reviewed for impairment at least annually or more frequently if impairment indicators are present. In assessing the carrying value of goodwill, we make qualitative and quantitative assumptions and estimates about revenues, operating margins, growth rates and discount rates based on our business plans, economic projections, anticipated future cash flows and marketplace data. There are inherent uncertainties related to these factors and management’s judgment in applying these factors. Goodwill valuations have been calculated using an income approach based on the present value of future cash flows of each reporting unit and a market approach. We could be required to evaluate the carrying value of goodwill prior to the annual assessment if we experience
19
unexpected, significant declines in operating results or sustained market capitalization declines. These types of events and the resulting analyses could result in goodwill impairment charges in the future. Impairment charges, such as the impairment charge that we recorded in the first quarter of fiscal 2019 related to the discontinuation of the Hay Group and Lominger brands, could substantially affect our results of operations and net worth in the periods of such charges.
We are a cyclical Company whose performance is tied to local and global economic conditions.
Demand for our services is affected by global economic conditions and the general level of economic activity in the geographic regions and industries in which we operate. When conditions in the global economy, including the credit markets deteriorate, or economic activity slows, many companies hire fewer permanent employees and some companies, as a cost-saving measure, choose to rely on their own human resources departments rather than third-party search firms to find talent, and under these conditions, companies may cut back on human resource initiatives, all of which negatively affects our financial condition and results of operations. We may also experience more competitive pricing pressure during periods of economic decline. If the geopolitical uncertainties result in a reduction in business confidence, if the national or global economy or credit market conditions in general deteriorate, the unemployment rate increases or any changes occur in U.S. trade policy (including any increases in tariffs that result in a trade war), such uncertainty or changes could put negative pressure on demand for our services and our pricing, resulting in lower cash flows and a negative effect on our business, financial condition and results of operations. In addition, some of our clients may experience reduced access to credit and lower revenues resulting in their inability to meet their payment obligations to us.
We face risks associated with social and political instability, legal requirements and economic conditions in our international operations.
We operate in 52 countries and, during the year ended April 30, 2019, generated 55% of our fee revenue from operations outside of the U.S. We are exposed to the risk of changes in social, political, legal and economic conditions inherent in international operations. Examples of risks inherent in transacting business worldwide that we are exposed to include:
|
|
▪ |
uncertainties and instability in economic and market conditions caused by the United Kingdom’s (the “U.K.”) vote to exit the E.U. (“Brexit”); |
|
|
▪ |
uncertainty regarding how the U.K.’s access to the E.U. Single Market and the wider trading, legal, regulatory and labor environments, especially in the U.K. and E.U., will be impacted by Brexit, including the resulting impact on our business and that of our clients; |
|
|
▪ |
changes in and compliance with applicable laws and regulatory requirements, including U.S. laws affecting the activities of U.S. companies abroad, including the Foreign Corrupt Practices Act of 1977 and sanctions programs administered by the U.S. Department of the Treasury Office of Foreign Assets Control, and similar foreign laws such as the U.K. Bribery Act, as well as the fact that many countries have legal systems, local laws and trade practices that are unsettled and evolving, and/or commercial laws that are vague and/or inconsistently applied; |
|
|
▪ |
difficulties in staffing and managing global operations, which could impact our ability to maintain an effective system of internal control; |
|
|
▪ |
difficulties in building and maintaining a competitive presence in existing and new markets; |
|
|
▪ |
social, economic and political instability; |
|
|
▪ |
differences in cultures and business practices; |
|
|
▪ |
statutory equity requirements; |
|
|
▪ |
differences in accounting and reporting requirements; |
|
|
▪ |
repatriation controls; |
|
|
▪ |
differences in labor and market conditions; |
20
|
|
▪ |
multiple regulations concerning pay rates, benefits, vacation, statutory holiday pay, workers’ compensation, union membership, termination pay, the termination of employment, and other employment laws; and |
|
|
▪ |
the introduction of greater uncertainty with respect to trade policies, tariffs, disputes or disruptions, the termination or suspension of treaties, boycotts and government regulation affecting trade between the U.S. and other countries. |
We cannot ensure that one or more of these factors will not harm our business, financial condition or results of operations.
The United Kingdom’s withdrawal from the E.U. may adversely impact our operations in the United Kingdom and elsewhere.
In fiscal 2019, 10.5% of our fee revenue was recorded in the U.K. The British government and the E.U. continue to negotiate the terms of the U.K.'s future relationship with the E.U. While many separation issues have been resolved, significant uncertainty remains. The uncertainties surrounding the timing and terms of the U.K.’s exit and its consequences could adversely impact customer and investor confidence, result in additional market volatility and adversely affect our businesses and results of operations. Completion of a so-called “hard/no-deal Brexit,” whereby the U.K. exits the E.U. with no negotiated market access or agreements on issues such as customs and citizen mobility, would likely cause economic, logistical, and legal disruptions. These impacts, and others that we cannot currently anticipate, could result in delays or reductions in contract awards, canceled contracts, changes in exchange rates, difficulty in recruiting or in gaining permission to employ existing staff, or less favorable payment terms. At this time, we cannot predict the impact that an actual exit from the E.U. will have on our business generally and our UK and European operations more specifically, and no assurance can be given that our operating results, financial condition and prospects would not be adversely impacted by the result.
The interest rates under our Credit Agreement and related interest rate swap may be impacted by the phase-out of the London Interbank Offered Rate (“LIBOR”).
LIBOR is the basic rate of interest used in lending between banks on the London interbank market and is widely used as a reference for setting the interest rates on loans globally. We generally use LIBOR as a reference rate to calculate interest rates under our credit facility. In 2017, the United Kingdom’s Financial Conduct Authority, which regulates LIBOR, announced that it intends to phase out LIBOR by the end of 2021. It is unclear if LIBOR will cease to exist at that time or if new methods of calculating LIBOR will be established such that it continues to exist after 2021. The U.S. Federal Reserve, in conjunction with the Alternative Reference Rates Committee, a steering committee comprised of large U.S. financial institutions, is considering replacing U.S. dollar LIBOR with a new index, the Secured Overnight Financing Rate (“SOFR”), calculated using short-term repurchase agreements backed by Treasury securities. Whether or not SOFR, or another alternative reference rate, attains market traction as a LIBOR replacement tool remains in question. If LIBOR ceases to exist, we may need to amend our Credit Agreement and related interest rate swap to replace LIBOR with an agreed upon replacement index, and certain of the interest rates under our Credit Agreement may change. The new rates may not be as favorable to us as those in effect prior to any LIBOR phase-out.
You may not receive the level of dividends provided for in the dividend policy our Board of Directors has adopted or any dividends at all.
We are not obligated to pay dividends on our common stock. Our Board of Directors adopted a dividend policy on December 8, 2014, that reflects an intention to distribute to our stockholders a regular quarterly cash dividend of $0.10 per share of common stock. Although the Company paid our first dividend under this program on April 9, 2015 and has declared a quarterly dividend every quarter since the adoption of the dividend policy, the declaration and payment of all future dividends to holders of our common stock are subject to the discretion of our Board of Directors, which may amend, revoke or suspend our dividend policy at any time and for any reason, including earnings, capital requirements, financial conditions and other factors our Board of Directors may deem relevant. The terms of our indebtedness may also restrict us from paying cash dividends on our common stock under certain circumstances. See below “—Our ability to pay dividends will be restricted by agreements governing our debt, including our credit agreement, and by Delaware law.”
Over time, our capital and other cash needs may change significantly from our current needs, which could affect whether we pay dividends and the level of any dividends we may pay in the future. If we were to use borrowings under our credit facility to fund our payment of dividends, we would have less cash and/or borrowing capacity available for future dividends and other purposes, which could negatively affect our financial condition, our results of operations, our liquidity and our ability to maintain and expand our business. Accordingly, you may not receive dividends in the intended amounts, or at all. Any reduction or elimination of dividends may negatively affect the market price of our common stock.
21
Our ability to pay dividends will be restricted by agreements governing our debt, including our credit agreement, and by Delaware law.
Our credit agreement restricts our ability to pay dividends. See “Management’s Discussion and Analysis of Financial Condition and Results of Operations—Liquidity and Capital Resources,” where we describe the terms of our indebtedness, including provisions limiting our ability to declare and pay dividends. As a result of such restrictions, we may be limited in our ability to pay dividends unless we amend our credit agreement or otherwise obtain a waiver from our lenders. In addition, as a result of general economic conditions, conditions in the lending markets, the results of our business or for any other reason, we may elect or be required to amend or refinance our senior credit facility, at or prior to maturity, or enter into additional agreements for indebtedness. Any such amendment, refinancing or additional agreement may contain covenants which could limit in a significant manner or entirely our ability to pay dividends to you.
Additionally, under the Delaware General Corporation Law (“DGCL”), our Board of Directors may not authorize payment of a dividend unless it is either paid out of surplus, as calculated in accordance with the DGCL, or if we do not have a surplus, out of net profits for the fiscal year in which the dividend is declared and/or the preceding fiscal year.
If, as a result of these restrictions, we are required to reduce or eliminate the payment of dividends, a decline in the market price or liquidity, or both, of our common stock could result. This may in turn result in losses by you.
Our dividend policy may limit our ability to pursue growth opportunities.
If we pay dividends at the level currently anticipated under our dividend policy, we may not retain a sufficient amount of cash to finance growth opportunities, meet any large unanticipated liquidity requirements or fund our operations in the event of a significant business downturn. In addition, because a portion of cash available will be distributed to holders of our common stock under our dividend policy, our ability to pursue any material expansion of our business, including through acquisitions, increased capital spending or other increases of our expenditures, will depend more than it otherwise would on our ability to obtain third party financing. We cannot assure you that such financing will be available to us at all, or at an acceptable cost. If we are unable to take timely advantage of growth opportunities, our future financial condition and competitive position may be harmed, which in turn may adversely affect the market price of our common stock.
We may be subject to the actions of activist shareholders.
Our Board of Directors and management team are committed to acting in the best interest of all of our shareholders. We value constructive input from investors and regularly engage in dialogue with our shareholders regarding strategy and performance. Activist shareholders who disagree with the composition of the Board of Directors, our strategy or the way the Company is managed may seek to effect change through various strategies and channels. Responding to shareholder activism can be costly and time-consuming, disrupt our operations, and divert the attention of management and our employees from our strategic initiatives. Activist campaigns can create perceived uncertainties as to our future direction, strategy, or leadership and may result in the loss of potential business opportunities, harm our ability to attract new employees, investors, and customers, and cause our stock price to experience periods of volatility or stagnation.
Our business could be disrupted as a result of actions of certain stockholders.
If any of our stockholders commence a proxy contest, advocate for change, make public statements critical of our performance or business, or engage in other similar activities, then our business could be adversely affected because we may have difficulty attracting and retaining clients due to perceived uncertainties as to our future direction and negative public statements about our business; responding to proxy contests and other similar actions by stockholders is likely to result in us incurring substantial additional costs and significantly divert the attention of management and our employees; and, if individuals are elected to our Board with a specific agenda, the execution of our strategic plan may be disrupted or a new strategic plan altogether may be implemented, which could have a material adverse impact on our business, financial condition or results of operations. Further, any of these matters or any such actions by stockholders may impact and result in volatility of the price of our common stock.
Our inability to successfully recover should we experience a disaster or other business continuity problem could cause material financial loss, loss of human capital, regulatory actions, reputational harm or legal liability.
Should we experience a disaster or other business continuity problem, such as an earthquake, hurricane, terrorist attack, pandemic, security breach, power loss, telecommunications failure or other natural or man-made disaster, our continued success will depend, in part, on the availability of our personnel, our office facilities, and the proper functioning of our computer, telecommunication and other related systems and operations. In such an event, we could experience near-term operational challenges with regard to particular areas of our operations. In particular, our
22
ability to recover from any disaster or other business continuity problem will depend on our ability to protect our technology infrastructure against damage from business continuity events that could have a significant disruptive effect on our operations. We could potentially lose client data or experience material adverse interruptions to our operations or delivery of services to our clients in a disaster. A disaster on a significant scale or affecting certain of our key operating areas within or across regions, or our inability to successfully recover should we experience a disaster or other business continuity problem, could materially interrupt our business operations and cause material financial loss, loss of human capital, regulatory actions, reputational harm, damaged client relationships or legal liability.
Item 1B. Unresolved Staff Comments
Not applicable.
Our corporate office is located in Los Angeles, California. We lease our corporate office and all 104 of our Executive Search, Advisory, and RPO & Professional Search offices located in North America, EMEA, Asia Pacific and Latin America. As of April 30, 2019, we leased an aggregate of approximately 1.4 million square feet of office space. The leases generally have remaining terms of one to 11 years and contain customary terms and conditions. We believe that our facilities are adequate for our current needs, and we do not anticipate any difficulty replacing such facilities or locating additional facilities to accommodate any future growth.
From time to time, we are involved in litigation both as a plaintiff and a defendant, relating to claims arising out of our operations. As of the date of this report, we are not engaged in any legal proceedings that are expected, individually or in the aggregate, to have a material adverse effect on our business, financial condition or results of operations.
Item 4. Mine Safety Disclosures
Not applicable.
Information about our Executive Officers
|
Name |
|
Age as of April 30, 2019 |
|
|
Position |
|
|
Gary D. Burnison |
|
|
58 |
|
|
President and Chief Executive Officer |
|
Robert P. Rozek |
|
|
58 |
|
|
Executive Vice President, Chief Financial Officer and Chief Corporate Officer |
|
Mark Arian |
|
|
58 |
|
|
Chief Executive Officer, Advisory |
|
Byrne Mulrooney |
|
|
58 |
|
|
Chief Executive Officer, RPO Professional Search & Products |
Our executive officers serve at the discretion of our Board of Directors. There is no family relationship between any executive officer or director. The following information sets forth the business experience for at least the past five years for each of our executive officers.
Gary D. Burnison has been President and Chief Executive Officer since July 2007. He was Executive Vice President and Chief Financial Officer from March 2002 until June 30, 2007, and Chief Operating Officer from November 2003 until June 30, 2007. Prior to joining Korn Ferry, Mr. Burnison was Principal and Chief Financial Officer of Guidance Solutions, a privately held consulting firm, from 1999 to 2001. Prior to that, he served as an executive officer and a member of the Board of Directors of Jefferies and Company, Inc., the principal operating subsidiary of Jefferies Group, Inc. from 1995 to 1999. Earlier, Mr. Burnison was a Partner at KPMG Peat Marwick. Mr. Burnison earned a bachelor’s degree in business administration from the University of Southern California.
Robert P. Rozek joined the Company in February 2012 as our Executive Vice President and Chief Financial Officer and, in December 2015, also became our Chief Corporate Officer. Prior to joining Korn Ferry, he served as Executive Vice President and Chief Financial Officer of Cushman & Wakefield, Inc., a privately held commercial real estate services firm, from June 2008 to February 2012. Prior to joining Cushman & Wakefield, Inc., Mr. Rozek served as Senior Vice President and Chief Financial Officer of Las Vegas Sands Corp., a leading global developer of destination properties (integrated resorts) that feature premium accommodations, world-class gaming and entertainment, convention and exhibition facilities and many other amenities, from 2006 to 2008. Prior to that, Mr. Rozek held senior leadership positions at Eastman Kodak, and spent five years as a Partner with PricewaterhouseCoopers LLP. Mr. Rozek is a graduate of Canisius College in New York with a bachelor’s degree in accounting.
23
Mark Arian joined the Company as Chief Executive Officer of Korn Ferry’s Advisory segment in April 2017. Prior to Korn Ferry, Mr. Arian served as a Managing Principal at Ernst and Young LLP, a multinational professional services firm that provides audit, tax, business risk, technology and security risk services, and human capital services worldwide, from March 2014 until March of 2017. In that capacity, he led the People Advisory Services—Financial Services Sector, and his responsibilities included commercial, people and key account leadership. Between 2008 and 2014, Mr. Arian held various leadership positions at AON and AON Hewitt, a provider of insurance, reinsurance, human capital and management consulting services, serving as an Executive Vice President and leading its strategic Mergers and Acquisitions (“M&A”) and business transformation offering globally. Mr. Arian has also held various leadership positions at Towers Perrin (now Wills Towers Watson) including serving as the Global M&A and Global Change Management leader, and Hewitt Associates, where Mr. Arian built and led the Corporate Restructuring and Change Practice. Mr. Arian is a graduate of Duke University and holds a juris doctorate from Columbia University.
Byrne Mulrooney joined the Company in April 2010 as Chief Executive Officer of RPO & Professional Search. Prior to joining Korn Ferry, he was President and Chief Operating Officer of Flynn Transportation Services, a third-party logistics company, from 2007 to 2010. Prior to that, he led Spherion’s workforce solutions business in North America, which provides workforce solutions in professional services and general staffing, including recruitment process outsourcing and managed services, from 2003 to 2007. Mr. Mulrooney held executive positions for almost 20 years at EDS and IBM in client services, sales, marketing and operations. Mr. Mulrooney is a graduate of Villanova University in Pennsylvania. He holds a master’s degree in management from Northwestern University’s J.L. Kellogg Graduate School of Management.
24
Item 5. Market for Registrant’s Common Equity, Related Stockholder Matters and Issuer Purchases of Equity Securities
Common Stock
Our common stock is listed on the New York Stock Exchange under the symbol ‘KFY’. On June 21, 2019, the last reported sales price on the New York Stock Exchange for the Company’s common stock, was $40.05 per share and there were approximately 24,047 beneficial stockholders of the Company’s common stock.
Performance Graph
We have presented below a graph comparing the cumulative total stockholder return on the Company’s shares with the cumulative total stockholder return on (1) the Standard & Poor’s 500 Stock Index and (2) a company-established peer group. Cumulative total return for each of the periods shown in the performance graph is measured assuming an initial investment of $100 on April 30, 2014 and the reinvestment of any dividends paid by the Company and any company in the peer group on the date the dividends were paid.
Our peer group is comprised of a broad number of publicly traded companies, which are principally or in significant part involved in either professional staffing or consulting. The peer group is comprised of the following 13 companies: CBIZ, Inc. (CBZ), FTI Consulting, Inc. (FCN), Heidrick & Struggles International, Inc. (HSII), Huron Consulting Group Inc. (HURN), ICF International, Inc. (ICFI), Insperity, Inc. (NSP), Kelly Services, Inc. (KELYA), Kforce Inc. (KFRC), Navigant Consulting, Inc. (NCI), Resources Connection, Inc. (RECN), Robert Half International, Inc. (RHI), Willis Towers Watson (WLTW) and TrueBlue, Inc. (TBI). We believe this group of professional services firms is reflective of similar sized companies in terms of our market capitalization, revenue or profitability, and therefore provides a more meaningful comparison of stock performance. The returns of each company have been weighted according to their respective stock market capitalization at the beginning of each measurement period for purposes of arriving at a peer group average.
The stock price performance depicted in this graph is not necessarily indicative of future price performance. This graph will not be deemed to be incorporated by reference by any general statement incorporating this Annual Report on Form 10-K into any filing by us under the Securities Act of 1933 or the Securities Exchange Act of 1934, except to the extent we specifically incorporate this information by reference and shall not otherwise be deemed soliciting material or deemed filed under the Securities Act of 1933 or the Securities Exchange Act of 1934.
COMPARISON OF 5 YEAR CUMULATIVE TOTAL RETURN(*)
Among Korn Ferry, the S&P 500 Index, and a Peer Group
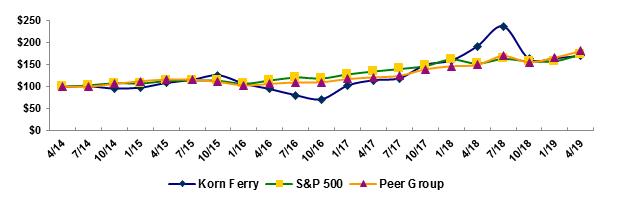
Copyright© 2019 Standard & Poor's, a division of S&P Global. All rights reserved.
|
(*) |
$100 invested on April 30, 2014 in stock or index, including reinvestment of dividends. Fiscal year ended April 30, 2019. |
25
The Company and its Board of Directors endorse a balanced approach to capital allocation. The Company’s first priority is to invest in growth initiatives, such as the hiring of consultants, the continued development of IP and derivative products and services, and the investment in synergistic accretive M&A transactions that earn a return superior to the Company's cost of capital. Next, the Company’s capital allocation approach contemplates the planned return of a portion of excess capital to stockholders, in the form of a regular quarterly dividend, subject to the factors discussed below under “Dividends” and in more detail in the “Risk Factors” section of this Annual Report on Form 10-K. Additionally, the Company considers share repurchases on an opportunistic basis and subject to the terms of our Credit Agreement. See Note 10— Long Term Debt for a description of the Credit Agreement.
Dividends
On December 8, 2014, the Board of Directors adopted a dividend policy, reflecting an intention to distribute to our stockholders a regular quarterly cash dividend of $0.10 per share.
The declaration and payment of future dividends under the quarterly dividend policy will be at the discretion of the Board of Directors and will depend upon many factors, including the Company’s earnings, capital requirements, financial conditions, the terms of the Company’s indebtedness and other factors that the Board of Directors may deem to be relevant. The Board of Directors may amend, revoke or suspend the dividend policy at any time and for any reason.
Stock Repurchase Program
On March 6, 2019, the Board of Directors approved an increase in the Company’s stock repurchase program of approximately $200 million, which brings our available capacity to repurchase shares in the open market or privately negotiated transactions to approximately $250 million. Common stock may be repurchased from time to time in open market or privately negotiated transactions at the Company’s discretion subject to market conditions and other factors. During the second quarter of fiscal 2017, the Company began to repurchase shares through this program. The Company repurchased approximately $37.4 million, $33.1 million and $28.8 million of the Company’s common stock during fiscal 2019, 2018 and 2017, respectively. Any decision to execute on our stock repurchase program will depend on our earnings, capital requirements, financial condition and other factors considered relevant by our Board of Directors. Our credit agreement permits us to pay dividends to our stockholders and make share repurchases so long as our pro forma leverage ratio is no greater than 3.25 to 1.00, and our pro forma domestic liquidity is at least $50.0 million, including the revolving credit commitment minus amounts outstanding on the revolver, issued letters of credit and swing loans.
Issuer Purchases of Equity Securities
The following table summarizes common stock repurchased by us during the fourth quarter of fiscal 2019:
|
|
|
Shares Purchased (1) |
|
|
Average Price Paid Per Share |
|
|
Shares Purchased as Part of Publicly- Announced Programs (2) |
|
|
Approximate Dollar Value of Shares that May Yet be Purchased under the Programs (2) |
|||
|
February 1, 2019 — February 28, 2019 |
|
|
— |
|
|
$ |
— |
|
|
|
— |
|
|
$50.7 million |
|
March 1, 2019 — March 31, 2019 |
|
|
3,245 |
|
|
$ |
48.66 |
|
|
|
— |
|
|
$250.7 million |
|
April 1, 2019 — April 30, 2019 |
|
|
904 |
|
|
$ |
46.50 |
|
|
|
— |
|
|
$250.7 million |
|
Total |
|
|
4,149 |
|
|
$ |
48.19 |
|
|
|
— |
|
|
|
|
(1) |
Represents withholding of a portion of restricted shares to cover taxes on vested restricted shares. |
|
(2) |
On March 6, 2019, our Board of Directors approved an increase to the share repurchase program to an aggregate of $250 million. The shares can be repurchased in open market transactions or privately negotiated transactions at the Company’s discretion. The share repurchase program has no expiration date. |
26
Item 6. Selected Financial Data
The following selected financial data are qualified by reference to, and should be read together with, our “Audited Consolidated Financial Statements and Notes to Consolidated Financial Statements” and “Management’s Discussion and Analysis of Financial Condition and Results of Operations” appearing elsewhere in this Annual Report on Form 10-K. The selected statements of income data set forth below for the fiscal years ended April 30, 2019, 2018 and 2017 and the selected balance sheets data as of April 30, 2019 and 2018 are derived from our audited consolidated financial statements, appearing elsewhere in this Annual Report on Form 10-K. The selected balance sheets data as of April 30, 2017, 2016 and 2015 and the selected statement of income data set forth below for the fiscal years ended April 30, 2016 and 2015 are derived from audited consolidated financial statements and notes thereto which are not included in this Annual Report on Form 10-K.
|
|
|
Year Ended April 30, |
|
|||||||||||||||||
|
|
|
2019 |
|
|
2018 |
|
|
2017 |
|
|
2016 (1) |
|
|
2015 |
|
|||||
|
|
|
(in thousands, except per share data and other operating data) |
|
|||||||||||||||||
|
Selected Consolidated Statements of Income Data: |
|
|
|
|
|
|
|
|
|
|
|
|
|
|
|
|
|
|
|
|
|
Fee revenue |
|
$ |
1,926,033 |
|
|
$ |
1,767,217 |
|
|
$ |
1,565,521 |
|
|
$ |
1,292,112 |
|
|
$ |
1,028,152 |
|
|
Reimbursed out-of-pocket engagement expenses |
|
|
47,829 |
|
|
|
52,302 |
|
|
|
56,148 |
|
|
|
54,602 |
|
|
|
37,914 |
|
|
Total revenue |
|
|
1,973,862 |
|
|
|
1,819,519 |
|
|
|
1,621,669 |
|
|
|
1,346,714 |
|
|
|
1,066,066 |
|
|
|
|
|
|
|
|
|
|
|
|
|
|
|
|
|
|
|
|
|
|
|
|
Compensation and benefits |
|
|
1,311,240 |
|
|
|
1,199,057 |
|
|
|
1,065,659 |
|
|
|
891,472 |
|
|
|
685,411 |
|
|
General and administrative expenses |
|
|
351,991 |
|
|
|
237,390 |
|
|
|
226,232 |
|
|
|
213,018 |
|
|
|
145,917 |
|
|
Reimbursed expenses |
|
|
47,829 |
|
|
|
52,302 |
|
|
|
56,148 |
|
|
|
54,602 |
|
|
|
37,914 |
|
|
Cost of services |
|
|
75,487 |
|
|
|
73,658 |
|
|
|
71,482 |
|
|
|
59,824 |
|
|
|
39,692 |
|
|
Depreciation and amortization |
|
|
46,489 |
|
|
|
48,588 |
|
|
|
47,260 |
|
|
|
36,220 |
|
|
|
27,597 |
|
|
Restructuring charges, net (2) |
|
|
— |
|
|
|
78 |
|
|
|
34,600 |
|
|
|
33,013 |
|
|
|
9,468 |
|
|
Total operating expenses |
|
|
1,833,036 |
|
|
|
1,611,073 |
|
|
|
1,501,381 |
|
|
|
1,288,149 |
|
|
|
945,999 |
|
|
|
|
|
|
|
|
|
|
|
|
|
|
|
|
|
|
|
|
|
|
|
|
Operating income |
|
|
140,826 |
|
|
|
208,446 |
|
|
|
120,288 |
|
|
|
58,565 |
|
|
|
120,067 |
|
|
Other income (loss), net |
|
|
10,094 |
|
|
|
11,119 |
|
|
|
10,328 |
|
|
|
(6,409 |
) |
|
|
4,408 |
|
|
Interest expense, net |
|
|
(16,891 |
) |
|
|
(13,832 |
) |
|
|
(14,607 |
) |
|
|
(3,394 |
) |
|
|
(4,773 |
) |
|
Equity in earnings of unconsolidated subsidiaries, net |
|
|
311 |
|
|
|
297 |
|
|
|
333 |
|
|
|
1,631 |
|
|
|
2,181 |
|
|
Income tax provision |
|
|
29,544 |
|
|
|
70,133 |
|
|
|
29,104 |
|
|
|
18,960 |
|
|
|
33,526 |
|
|
Net income |
|
|
104,796 |
|
|
|
135,897 |
|
|
|
87,238 |
|
|
|
31,433 |
|
|
|
88,357 |
|
|
Net income attributable to noncontrolling interest |
|
|
(2,145 |
) |
|
|
(2,118 |
) |
|
|
(3,057 |
) |
|
|
(520 |
) |
|
|
— |
|
|
Net income attributable to Korn Ferry |
|
$ |
102,651 |
|
|
$ |
133,779 |
|
|
$ |
84,181 |
|
|
$ |
30,913 |
|
|
$ |
88,357 |
|
|
Basic earnings per share |
|
$ |
1.84 |
|
|
$ |
2.39 |
|
|
$ |
1.48 |
|
|
$ |
0.58 |
|
|
$ |
1.78 |
|
|
Diluted earnings per share |
|
$ |
1.81 |
|
|
$ |
2.35 |
|
|
$ |
1.47 |
|
|
$ |
0.58 |
|
|
$ |
1.76 |
|
|
Basic weighted average common shares outstanding |
|
|
55,311 |
|
|
|
55,426 |
|
|
|
56,205 |
|
|
|
52,372 |
|
|
|
49,052 |
|
|
Diluted weighted average common shares outstanding |
|
|
56,096 |
|
|
|
56,254 |
|
|
|
56,900 |
|
|
|
52,929 |
|
|
|
49,766 |
|
|
Cash dividends declared per common share |
|
$ |
0.40 |
|
|
$ |
0.40 |
|
|
$ |
0.40 |
|
|
$ |
0.40 |
|
|
$ |
0.10 |
|
|
Other Operating Data: |
|
|
|
|
|
|
|
|
|
|
|
|
|
|
|
|
|
|
|
|
|
Fee revenue by segment: |
|
|
|
|
|
|
|
|
|
|
|
|
|
|
|
|
|
|
|
|
|
Executive search: |
|
|
|
|
|
|
|
|
|
|
|
|
|
|
|
|
|
|
|
|
|
North America |
|
$ |
455,826 |
|
|
$ |
408,098 |
|
|
$ |
356,625 |
|
|
$ |
371,345 |
|
|
$ |
330,634 |
|
|
EMEA |
|
|
182,829 |
|
|
|
173,725 |
|
|
|
146,506 |
|
|
|
144,319 |
|
|
|
153,465 |
|
|
Asia Pacific |
|
|
104,291 |
|
|
|
96,595 |
|
|
|
80,169 |
|
|
|
80,506 |
|
|
|
84,148 |
|
|
Latin America |
|
|
31,896 |
|
|
|
30,624 |
|
|
|
34,376 |
|
|
|
26,744 |
|
|
|
29,160 |
|
|
Total executive search |
|
|
774,842 |
|
|
|
709,042 |
|
|
|
617,676 |
|
|
|
622,914 |
|
|
|
597,407 |
|
|
Advisory |
|
|
821,048 |
|
|
|
785,013 |
|
|
|
724,186 |
|
|
|
471,145 |
|
|
|
267,018 |
|
|
RPO & Professional Search |
|
|
330,143 |
|
|
|
273,162 |
|
|
|
223,659 |
|
|
|
198,053 |
|
|
|
163,727 |
|
|
Total fee revenue |
|
$ |
1,926,033 |
|
|
$ |
1,767,217 |
|
|
$ |
1,565,521 |
|
|
$ |
1,292,112 |
|
|
$ |
1,028,152 |
|
|
Number of offices (at period end) (3) |
|
|
104 |
|
|
|
106 |
|
|
|
114 |
|
|
|
150 |
|
|
|
78 |
|
|
Number of consultants (at period end) |
|
|
1,448 |
|
|
|
1,392 |
|
|
|
1,330 |
|
|
|
1,164 |
|
|
|
694 |
|
|
Number of new engagements opened |
|
|
9,725 |
|
|
|
9,149 |
|
|
|
8,126 |
|
|
|
7,430 |
|
|
|
6,755 |
|
|
Number of full-time employees: |
|
|
|
|
|
|
|
|
|
|
|
|
|
|
|
|
|
|
|
|
|
Executive search |
|
|
1,960 |
|
|
|
1,865 |
|
|
|
1,791 |
|
|
|
1,682 |
|
|
|
1,562 |
|
|
Advisory |
|
|
3,603 |
|
|
|
3,454 |
|
|
|
3,598 |
|
|
|
3,626 |
|
|
|
894 |
|
|
RPO & Professional Search |
|
|
2,942 |
|
|
|
2,188 |
|
|
|
1,710 |
|
|
|
1,530 |
|
|
|
1,147 |
|
|
Corporate |
|
|
173 |
|
|
|
136 |
|
|
|
133 |
|
|
|
109 |
|
|
|
84 |
|
|
Total full-time employees |
|
|
8,678 |
|
|
|
7,643 |
|
|
|
7,232 |
|
|
|
6,947 |
|
|
|
3,687 |
|
|
Selected Consolidated Balance Sheets Data as of April 30: |
|
|
|
|
|
|
|
|
|
|
|
|
|
|
|
|
|
|
|
|
|
Cash and cash equivalents |
|
$ |
626,360 |
|
|
$ |
520,848 |
|
|
$ |
410,882 |
|
|
$ |
273,252 |
|
|
$ |
380,838 |
|
|
Marketable securities (4) |
|
|
140,751 |
|
|
|
137,085 |
|
|
|
119,937 |
|
|
|
141,430 |
|
|
|
144,576 |
|
|
Working capital |
|
|
585,852 |
|
|
|
455,799 |
|
|
|
385,095 |
|
|
|
188,010 |
|
|
|
331,148 |
|
|
Total assets |
|
|
2,334,852 |
|
|
|
2,287,914 |
|
|
|
2,062,898 |
|
|
|
1,898,600 |
|
|
|
1,317,801 |
|
|
Long-term obligations |
|
|
540,507 |
|
|
|
509,839 |
|
|
|
517,271 |
|
|
|
375,035 |
|
|
|
196,542 |
|
|
Total stockholders’ equity |
|
|
1,243,387 |
|
|
|
1,219,615 |
|
|
|
1,087,048 |
|
|
|
1,047,301 |
|
|
|
815,249 |
|
|
(1) |
Due to the acquisition of Hay Group on December 1, 2015, which accounted for $186.8 million and $740.2 million of fee revenue and total assets, respectively, during fiscal 2016, financial data trends for fiscal 2016 are not comparable to the prior period. |
27
|
(3) |
The number of offices decreased by eight as of April 30, 2018 compared to April 30, 2017 and 36 as of April 30, 2017 compared to April 30, 2016, due to the continued implementation of the 2016 restructuring plan. |
|
(4) |
As of April 30, 2019, 2018, 2017, 2016, and 2015, the Company’s marketable securities included $140.8 million, $137.1 million, $119.9 million, $141.4 million, and $131.4 million, respectively, held in trust for settlement of the Company’s obligations under certain of its deferred compensation plans. See Note 5—Financial Instruments in the Notes to the Consolidated Financial Statements in this Annual Report on Form 10-K. |
28
Item 7. Management’s Discussion and Analysis of Financial Condition and Results of Operations
Forward-looking Statements
This Annual Report on Form 10-K may contain certain statements that we believe are, or may be considered to be, “forward-looking” statements, within the meaning of Section 27A of the Securities Act of 1933, as amended and Section 21E of the Securities Exchange Act of 1934, as amended (the “Exchange Act”). These forward-looking statements generally can be identified by use of statements that include phrases such as “believe,” “expect,” “anticipate,” “intend,” “plan,” “foresee,” “may,” “will,” “likely,” “estimates,” “potential,” “continue” or other similar words or phrases. Similarly, statements that describe our objectives, plans or goals also are forward-looking statements. All of these forward-looking statements are subject to risks and uncertainties that could cause our actual results to differ materially from those contemplated by the relevant forward-looking statement. The principal risk factors that could cause actual performance and future actions to differ materially from the forward-looking statements include, but are not limited to, changes in demand for our services as a result of automation, dependence on attracting and retaining qualified and experienced consultants, maintaining our relationships with customers and suppliers and retaining key employees, maintaining our brand name and professional reputation, the expected timing of the consummation of the Plan, the impact of the rebranding on the Company’s products and services, the costs of the Plan, potential legal liability and regulatory developments, portability of client relationships, global and local political or economic developments in or affecting countries where we have operations, currency fluctuations in our international operations, risks related to growth, restrictions imposed by off-limits agreements, competition, consolidation in industries, reliance on information processing systems, cyber security vulnerabilities, changes to data security, data privacy, and data protection laws, limited protection of our intellectual property (“IP”), our ability to enhance and develop new technology, our ability to successfully recover from a disaster or business continuity problems, employment liability risk, an impairment in the carrying value of goodwill and other intangible assets, the effects of the Tax Cuts and Jobs Act (the “Tax Act”) and other future changes in tax laws, treaties, or regulations on our business and our company, deferred tax assets that we may not be able to use, our ability to develop new products and services, the impact of the withdrawal of the United Kingdom from the European Union, changes in our accounting estimates and assumptions, alignment of our cost structure, the utilization and billing rates of our consultants, seasonality, the phase-out of LIBOR, and the matters disclosed under the heading “Risk Factors” in the Company’s Exchange Act reports, including Item 1A included in this Annual Report on Form 10-K. Readers are urged to consider these factors carefully in evaluating the forward-looking statements. The forward-looking statements included in this Annual Report on Form 10-K are made only as of the date of this Annual Report on Form 10-K and we undertake no obligation to publicly update these forward-looking statements to reflect subsequent events or circumstances.
The following presentation of management’s discussion and analysis of our financial condition and results of operations should be read together with our consolidated financial statements and related notes included in this Annual Report on Form 10-K.
Executive Summary
Korn Ferry (referred to herein as the “Company” or in the first person notations “we,” “our,” and “us”) is a global organizational consulting firm. We currently operate through three global segments: Executive Search, Korn Ferry Advisory (Advisory) and Korn Ferry RPO and Professional Search (“RPO & Professional Search”). Executive Search focuses on recruiting board level, chief executive and other senior executive and general management positions, in addition to research-based interviewing and assessment solutions, for clients predominantly in the consumer goods, financial services, industrial, life sciences/healthcare and technology industries. Our Advisory segment assists clients to synchronize strategy and talent by addressing four fundamental needs: Organizational Strategy, Assessment and Succession, Leadership Development, and Rewards and Benefits, all underpinned by a comprehensive array of world-leading intellectual property, products and tools. RPO & Professional Search uses data-backed insight and IP, matched with strategic collaboration and innovative technology, to meet people challenges head-on—and succeed. Solutions span all aspects of Recruitment Process Outsourcing (“RPO”), Professional Search and Project Recruitment. We also operate a Corporate segment to record global expenses of the Company.
|
▪ |
Approximately 71% of the executive searches we performed in fiscal 2019 were for board level, chief executive and other senior executive and general management positions. Our 3,993 search engagement clients in fiscal 2019 included many of the world’s largest and most prestigious public and private companies. |
|
▪ |
We have built strong client loyalty, with 90% of the assignments performed during fiscal 2019 having been on behalf of clients for whom we had conducted assignments in the previous three fiscal years. |
|
▪ |
Approximately 70% of our revenues were generated from clients that utilize multiple lines of our business. |
29
|
▪ |
In fiscal 2019, Korn Ferry was recognized as a top five RPO provider in the Baker’s Dozen list, marking our 12th consecutive year on the list. Through decades of experience, we have enhanced our RPO solution to deliver quality candidates that drive our clients’ business strategies. We leverage proprietary IP and data sets to guide clients on the critical skills and competencies to look for, compensation Information to align with market demand, and assessment tools to ensure candidate fit. |
While most organizations can develop a sound strategy, they often struggle with how to make it stick. That is where we come in: synchronizing an organization’s strategy with its talent to drive superior performance. We help companies design their organization—the structure, roles and responsibilities—to seize these opportunities. In addition, we help organizations select and hire the talent they need to execute their strategy—and show them the best way to compensate, develop and motivate their people.
We do this through our five core solution sets:
|
Organizational Strategy |
We map talent strategy to business strategy by designing operating models and organizational structures that align to them, helping organizations put their plans into action. We make sure they have the right people, in the right roles, engaged and enabled to do the right things. |
|
Assessment and Succession |
We provide actionable, research-backed insights that allow organizations to understand the true capabilities of their people so they can make decisions that ensure the right leaders are ready—when and where they are needed—in the future. |
|
Talent Acquisition |
From executive search to recruitment process outsourcing (“RPO”), we integrate scientific research with our practical experience and industry-specific expertise to recruit professionals of all levels and functions for client organizations. |
|
Leadership Development |
We help leaders at all levels of an organization achieve their vision, purpose and strategy. We combine expertise, science and proven techniques with forward thinking and creativity to build leadership experiences that help entry- to senior-level leaders grow and deliver superior results. |
|
Rewards and Benefits |
We help organizations design rewards to achieve their strategic objectives. We help them pay their people fairly for doing the right things—with rewards they value—at a cost the organization can afford. |
On June 12, 2018, the Company’s Board of Directors approved the One Korn Ferry rebranding plan for the Company (the “Plan”). This Plan includes going to market under a single, master brand architecture, solely as Korn Ferry and sunsetting all the Company’s sub-brands, including Futurestep, Hay Group and Lominger, among others. This integrated go-to-market approach was a key driver in our fee revenue growth in fiscal year 2018, which led to the decision to further integrate our go-to-market activities under one master brand — Korn Ferry. As a result, the Company discontinued the use of all sub-brands and changed its name, effective January 1, 2019, to “Korn Ferry.” Two of the Company’s sub-brands, Hay Group and Lominger came to Korn Ferry through acquisitions. In connection with the accounting for these acquisitions, $106.6 million of the purchase price was allocated to indefinite-lived tradename intangible assets. As a result of the decision to discontinue their use, the Company took a one-time, non-cash write-off of tradenames of $106.6 million in fiscal 2019.
The Company currently operates through three global segments. See Note 11—Segments, in the Notes to our Consolidated Financial Statements in this Annual Report on Form 10-K, for additional discussion of the Company’s global segments. The Company evaluates performance and allocates resources based on the chief operating decision maker’s review of (1) fee revenue and (2) adjusted earnings before interest, taxes, depreciation and amortization (“Adjusted EBITDA”). To the extent that such charges occur, Adjusted EBITDA excludes restructuring charges, integration/acquisition costs, certain separation costs and certain non-cash charges (goodwill, intangible asset and other than temporary impairment). For fiscal 2017, Adjusted EBITDA included a deferred revenue adjustment related to a previous acquisition, reflecting revenue that Advisory would have realized if not for business combination accounting that required a company to record the acquisition balance sheet at fair value and write-off deferred revenue where no future services are required to be performed to earn that revenue. For fiscal 2019 and 2018, management no longer had adjusted fee revenue.
30
EBITDA, Adjusted EBITDA, and Adjusted EBITDA margin are non-GAAP financial measures. They have limitations as analytical tools, should not be viewed as a substitute for financial information determined in accordance with United States (“U.S.”) generally accepted accounting principles (“GAAP”) and should not be considered in isolation or as a substitute for analysis of the Company’s results as reported under GAAP. In addition, they may not necessarily be comparable to non-GAAP performance measures that may be presented by other companies.
Management believes the presentation of these non-GAAP financial measures provides meaningful supplemental information regarding Korn Ferry’s performance by excluding certain charges, items of income and other items that may not be indicative of Korn Ferry’s ongoing operating results. The use of these non-GAAP financial measures facilitates comparisons to Korn Ferry’s historical performance and the identification of operating trends that may otherwise be distorted by the factors discussed above. Korn Ferry includes these non-GAAP financial measures because management believes it is useful to investors in allowing for greater transparency with respect to supplemental information used by management in its evaluation of Korn Ferry’s ongoing operations and financial and operational decision-making. The accounting policies for the reportable segments are the same as those described in the summary of significant accounting policies in the accompanying consolidated financial statements, except that the above noted items are excluded from EBITDA to arrive at Adjusted EBITDA. Management further believes that EBITDA is useful to investors because it is frequently used by investors and other interested parties to measure operating performance among companies with different capital structures, effective tax rates and tax attributes and capitalized asset values, all of which can vary substantially from company to company.
Similarly, adjusted fee revenue, which includes revenue that Advisory would have realized over the ensuing year after the acquisition if not for business combination accounting that requires a company to record the acquisition balance sheet at fair value and write-off deferred revenue where no future services are required to be performed to earn that revenue, is a non-GAAP financial measure. Adjusted fee revenue is not a measure that substitutes an individually tailored revenue recognition or measurement method for those of GAAP; rather, it is an adjustment for a short period of time provides better comparability between fiscal 2017 and subsequent periods. Management believes the presentation of adjusted fee revenue assists management in its evaluation of ongoing operations and provides useful information to investors because it allows investors to make more meaningful period-to-period comparisons of the Company’s operating results, to better identify operating trends that may otherwise be distorted by write-offs required under business combination accounting and to perform related trend analysis and provides a higher degree of transparency of information used by management in its evaluation of Korn Ferry’s ongoing operations and financial and operational decision-making.
Fee revenue was $1,926.0 million during fiscal 2019, an increase of $158.8 million, or 9%, compared to $1,767.2 million in fiscal 2018, with increases in fee revenue in all segments. During fiscal 2019, we recorded operating income of $140.8 million with the Executive Search, Advisory and RPO & Professional Search segments contributing $179.1 million, $5.6 million (net of $106.6 million impairment charge previously discussed) and $50.9 million, respectively, offset by Corporate expenses of $94.8 million. Net income attributable to Korn Ferry decreased by $31.1 million during fiscal 2019 to $102.7 million from $133.8 million in fiscal 2018. Adjusted EBITDA was $311.0 million, an increase of $33 million during fiscal 2019, from Adjusted EBITDA of $278.0 million in the year-ago period. During fiscal 2019, the Executive Search, Advisory and RPO & Professional Search segments contributed $193.8 million, $151.0 million and $54.4 million, respectively, offset by Corporate expenses net of other income of $88.2 million.
Our cash, cash equivalents and marketable securities increased by $109.2 million to $767.1 million at April 30, 2019, compared to $657.9 million at April 30, 2018. This increase was mainly due to proceeds from our Revolver of $226.9 million and cash provided by operating activities, offset by annual bonuses earned in fiscal 2018 and paid during fiscal 2019, sign-on and retention payments, $238.9 million in principal payments on our term loan, $46.7 million in payments for the purchase of property and equipment, $37.4 million in stock repurchases in the open market, $20.7 million paid in tax withholding on restricted stock vestings and $23.5 million in dividends paid during fiscal 2019. As of April 30, 2019, we held marketable securities to settle obligations under our Executive Capital Accumulation Plan (“ECAP”) with a cost value of $135.4 million and a fair value of $140.8 million. Our vested obligations for which these assets were held in trust totaled $122.3 million as of April 30, 2019 and our unvested obligations totaled $24.6 million.
Our working capital increased by $130.1 million to $585.9 million in fiscal 2019. We believe that cash on hand and funds from operations and other forms of liquidity will be sufficient to meet our anticipated working capital, capital expenditures, general corporate requirements, repayment of our debt obligations and dividend payments under our dividend policy in the next twelve months. We had $420.2 million available for borrowing under our Revolver at April 30, 2019. As of April 30, 2018, we had no borrowings under our previous revolver. As of April 30, 2018, we had a total of $122.1 million available under the previous revolver after issued letters of credit. As of April 30, 2019 and 2018, there was $2.9 million of standby letters of credit issued under our long-term debt arrangements. We had a total of $8.5 million and $7.4 million of standby letters of credits with other financial institutions as of April 30, 2019 and 2018, respectively.
Critical Accounting Policies
The following discussion and analysis of our financial condition and results of operations are based on our consolidated financial statements. Preparation of our periodic filings requires us to make estimates and assumptions that affect the reported amount of assets and liabilities and disclosure of contingent assets and liabilities at the date of
31
our financial statements and the reported amounts of revenue and expenses during the reporting period. Actual results could differ from those estimates and assumptions and changes in the estimates are reported in current operations as new information is learned or upon the amounts becoming fixed and determinable. In preparing our consolidated financial statements and accounting for the underlying transactions and balances, we apply our accounting policies as disclosed in the notes to our consolidated financial statements. We consider the policies discussed below as critical to an understanding of our consolidated financial statements because their application places the most significant demands on management’s judgment and estimates. Specific risks for these critical accounting policies are described in the following paragraphs. Senior management has discussed the development, selection and key assumptions of the critical accounting estimates with the Audit Committee of the Board of Directors.
Revenue Recognition. Substantially all fee revenue is derived from fees for professional services related to executive and professional recruitment performed on a retained basis, recruitment process outsourcing, talent and organizational advisory services and the sale of product services, either stand-alone or as part of a solution.
Revenue is recognized when control of the goods and services are transferred to the customer, in an amount that reflects the consideration that we expect to be entitled to in exchange for those goods and services. Revenue contracts with customers are evaluated based on the five-step model outlined in Accounting Standard Codification 606 (“ASC 606”): 1) identify the contract with a customer; 2) identify the performance obligation(s) in the contract; 3) determine the transaction price; 4) allocate the transaction price to the separate performance obligation(s); and 5) recognize revenue when (or as) each performance obligation is satisfied.
Fee revenue from executive and non-executive professional search activities is generally one-third of the estimated first year compensation of the placed candidate plus a percentage of the fee to cover indirect engagement related expenses. In addition to the search retainer, an uptick fee is billed when the actual compensation awarded by the client for a placement is higher than the estimated compensation. In the aggregate, upticks have been a relatively consistent percentage of the original estimated fee; therefore, we estimate upticks using the expected value method based on historical data on a portfolio basis. In a standard search engagement, there is one performance obligation which is the promise to undertake a search. We generally recognize such revenue over the course of a search and when it is legally entitled to payment as outlined in the billing terms of the contract. Any revenues associated with services that are provided on a contingent basis are recognized once the contingency is resolved as this is when control is transferred to the customer. These assumptions determine the timing of revenue recognition for the reported period.
RPO fee revenue is generated through two distinct phases: 1) the implementation phase and 2) the post-implementation recruitment phase. The fees associated with the implementation phase are recognized over the period that the related implementation services are provided. The post-implementation recruitment phase represents end-to-end recruiting services to clients for which there are both fixed and variable fees, which are recognized over the period that the related recruiting services are performed.
Consulting fee revenue, primarily generated from Advisory, is recognized as services are rendered, measured by total hours incurred to the total estimated hours at completion. It is possible that updated estimates for consulting engagements may vary from initial estimates with such updates being recognized in the period of determination. Depending on the timing of billings and services rendered, we accrue or defer revenue as appropriate.
Product revenue is generated from a range of online tools designed to support human resource processes for pay, talent and engagement, and assessments, as well as licenses to proprietary intellectual property (“IP”) and tangible/digital products. IP subscriptions grant access to proprietary compensation and job evaluation databases. IP subscriptions are considered symbolic IP due to the dynamic nature of the content and, as a result, revenue is recognized over the term of the contract. Functional IP licenses grant customers the right to use IP content via delivery of a flat file. Because the IP content license has significant stand-alone functionality, revenue is recognized upon delivery and when an enforceable right to payment exists. Online assessments are delivered in the form of online questionnaires. A bundle of assessments represents one performance obligation, and revenue is recognized as assessment services are delivered and we have a legally enforceable right to payment. Tangible/digital products sold by us mainly consist of books and digital files covering a variety of topics including performance management, team effectiveness, and coaching and development. We recognize revenue for our products when sold or shipped, as is the case for books.
Annual Performance-Related Bonuses. Each quarter, management makes its best estimate of its annual performance related bonuses, which requires management to, among other things, project annual consultant productivity (as measured by engagement fees billed and collected by executive search consultants and revenue and other performance/profitability metrics for Advisory and RPO & Professional Search consultants), the level of engagements referred by a consultant in one line of business to a different line of business, our performance including profitability, competitive forces and future economic conditions and their impact on our results. At the end of each fiscal year, annual performance related bonuses take into account final individual consultant productivity (including referred work), Company/line of business results including profitability, the achievement of strategic
32
objectives and the results of individual performance appraisals, and the current economic landscape. Accordingly, each quarter we reevaluate the assumptions used to estimate annual performance related bonus liability and adjust the carrying amount of the liability recorded on the consolidated balance sheets and report any changes in the estimate in current operations. Because annual performance-based bonuses are communicated and paid only after we report our full fiscal year results, actual performance-based bonus payments may differ from the prior year’s estimate. Such changes in the bonus estimate historically have been immaterial and are recorded in current operations in the period in which they are determined.
Deferred Compensation. Estimating deferred compensation requires assumptions regarding the timing and probability of payments of benefits to participants and the discount rate. Changes in these assumptions could significantly impact the liability and related cost on our consolidated balance sheets and statements of income, respectively. For certain deferred compensation plans, management engages an independent actuary to periodically review these assumptions in order to confirm that they reflect the population and economics of our deferred compensation plans in all material respects and to assist us in estimating our deferred compensation liability and the related cost. The actuarial assumptions we use may differ from actual results due to changing market conditions or changes in the participant population. These differences could have a significant impact on our deferred compensation liability and the related cost.
Carrying Values. Valuations are required under GAAP to determine the carrying value of various assets. Our most significant assets for which management is required to prepare valuations are carrying value of receivables, goodwill, intangible assets and recoverability of deferred income taxes. Management must identify whether events have occurred that may impact the carrying value of these assets and make assumptions regarding future events, such as cash flows and profitability. Differences between the assumptions used to prepare these valuations and actual results could materially impact the carrying amount of these assets and our operating results.
Of the assets mentioned above, goodwill is the largest asset requiring a valuation. Fair value of goodwill for purposes of the goodwill impairment test is determined utilizing (1) a discounted cash flow analysis based on forecasted cash flows (including estimated underlying revenue and operating income growth rates) discounted using an estimated weighted-average cost of capital for market participants and (2) a market approach, utilizing observable market data such as comparable companies in similar lines of business that are publicly traded or which are part of a public or private transaction (to the extent available). We also reconcile the results of these analyses to its market capitalization. If the carrying amount of a reporting unit exceeds its estimated fair value, goodwill is considered potentially impaired and further tests are performed to measure the amount of impairment loss, if any. We recorded no goodwill impairment in conjunction with our annual goodwill impairment assessment performed as of January 31, 2019. While historical performance and current expectations have resulted in fair values of goodwill in excess of carrying values, if our assumptions are not realized, it is possible that in the future an impairment charge may need to be recorded. However, it is not possible at this time to determine if an impairment charge would result or if such a charge would be material. Fair value determinations require considerable judgment and are sensitive to changes in underlying assumptions and factors. As a result, there can be no assurance that the estimates and assumptions made for purposes of the annual goodwill impairment test will prove to be accurate predictions of the future. As of our testing date, the fair value of each reporting unit exceeded its carrying amount and no reporting units were at risk of failing the impairment test. As a result, no impairment charge was recognized. There was also no indication of potential impairment during the fourth quarter of fiscal 2019 that would have required further testing.
Examples of events or circumstances that could reasonably be expected to negatively affect the underlying key assumptions and ultimately impact the estimated fair value of the reporting units may include such items as follows:
|
|
▪ |
A prolonged downturn in the business environment in which the reporting units operate; |
|
|
▪ |
An economic climate that significantly differs from our future profitability assumptions in timing or degree; |
|
|
▪ |
The deterioration of the labor markets; |
|
|
▪ |
Volatility in equity and debt markets; and |
|
|
▪ |
Competition and disruption in our core business. |
33
The following table summarizes the results of our operations as a percentage of fee revenue:
|
|
|
Year Ended April 30, |
|
|||||||||
|
|
2019 |
|
|
2018 |
|
|
2017 |
|
||||
|
Fee revenue |
|
|
100.0 |
% |
|
|
100.0 |
% |
|
|
100.0 |
% |
|
Reimbursed out-of-pocket engagement expenses |
|
|
2.5 |
|
|
|
3.0 |
|
|
|
3.6 |
|
|
Total revenue |
|
|
102.5 |
|
|
|
103.0 |
|
|
|
103.6 |
|
|
Compensation and benefits |
|
|
68.1 |
|
|
|
67.9 |
|
|
|
68.0 |
|
|
General and administrative expenses (1) |
|
|
18.3 |
|
|
|
13.4 |
|
|
|
14.5 |
|
|
Reimbursed expenses |
|
|
2.5 |
|
|
|
3.0 |
|
|
|
3.6 |
|
|
Cost of services |
|
|
3.9 |
|
|
|
4.2 |
|
|
|
4.6 |
|
|
Depreciation and amortization |
|
|
2.4 |
|
|
|
2.7 |
|
|
|
3.0 |
|
|
Restructuring charges, net |
|
|
— |
|
|
|
— |
|
|
|
2.2 |
|
|
Operating income |
|
|
7.3 |
|
|
|
11.8 |
|
|
|
7.7 |
|
|
Net income |
|
|
5.4 |
% |
|
|
7.7 |
% |
|
|
5.6 |
% |
|
Net income attributable to Korn Ferry |
|
|
5.3 |
% |
|
|
7.6 |
% |
|
|
5.4 |
% |
|
(1) |
General and administrative expenses for fiscal 2019 includes write-off of tradenames of $106.6 million. |
The following tables summarize the results of our operations by segment:
(Numbers may not total exactly due to rounding)
|
|
|
Year Ended April 30, |
|
|||||||||||||||||||||
|
|
|
2019 |
|
|
2018 |
|
|
2017 |
|
|||||||||||||||
|
|
|
Dollars |
|
|
% |
|
|
Dollars |
|
|
% |
|
|
Dollars |
|
|
% |
|
||||||
|
|
|
(dollars in thousands) |
|
|||||||||||||||||||||
|
Fee revenue |
|
|
|
|
|
|
|
|
|
|
|
|
|
|
|
|
|
|
|
|
|
|
|
|
|
Executive Search: |
|
|
|
|
|
|
|
|
|
|
|
|
|
|
|
|
|
|
|
|
|
|
|
|
|
North America |
|
$ |
455,826 |
|
|
|
23.7 |
% |
|
$ |
408,098 |
|
|
|
23.1 |
% |
|
$ |
356,625 |
|
|
|
22.8 |
% |
|
EMEA |
|
|
182,829 |
|
|
|
9.5 |
|
|
|
173,725 |
|
|
|
9.8 |
|
|
|
146,506 |
|
|
|
9.4 |
|
|
Asia Pacific |
|
|
104,291 |
|
|
|
5.4 |
|
|
|
96,595 |
|
|
|
5.5 |
|
|
|
80,169 |
|
|
|
5.1 |
|
|
Latin America |
|
|
31,896 |
|
|
|
1.7 |
|
|
|
30,624 |
|
|
|
1.7 |
|
|
|
34,376 |
|
|
|
2.2 |
|
|
Total Executive Search |
|
|
774,842 |
|
|
|
40.2 |
|
|
|
709,042 |
|
|
|
40.1 |
|
|
|
617,676 |
|
|
|
39.5 |
|
|
Advisory |
|
|
821,048 |
|
|
|
42.6 |
|
|
|
785,013 |
|
|
|
44.4 |
|
|
|
724,186 |
|
|
|
46.3 |
|
|
RPO & Professional Search |
|
|
330,143 |
|
|
|
17.1 |
|
|
|
273,162 |
|
|
|
15.5 |
|
|
|
223,659 |
|
|
|
14.3 |
|
|
Total fee revenue |
|
|
1,926,033 |
|
|
|
100.0 |
% |
|
|
1,767,217 |
|
|
|
100.0 |
% |
|
|
1,565,521 |
|
|
|
100.0 |
% |
|
Reimbursed out-of-pocket engagement expense |
|
|
47,829 |
|
|
|
|
|
|
|
52,302 |
|
|
|
|
|
|
|
56,148 |
|
|
|
|
|
|
Total revenue |
|
$ |
1,973,862 |
|
|
|
|
|
|
$ |
1,819,519 |
|
|
|
|
|
|
$ |
1,621,669 |
|
|
|
|
|
|
|
|
Year Ended April 30, |
|
|||||||||||||||||||||
|
|
|
2019 |
|
|
2018 |
|
|
2017 |
|
|||||||||||||||
|
|
|
Dollars |
|
|
Margin(1) |
|
|
Dollars |
|
|
Margin(1) |
|
|
Dollars |
|
|
Margin(1) |
|
||||||
|
|
|
(dollars in thousands) |
|
|||||||||||||||||||||
|
Operating income (loss) |
|
|
|
|
|
|
|
|
|
|
|
|
|
|
|
|
|
|
|
|
|
|
|
|
|
Executive Search: |
|
|
|
|
|
|
|
|
|
|
|
|
|
|
|
|
|
|
|
|
|
|
|
|
|
North America |
|
$ |
120,754 |
|
|
|
26.5 |
% |
|
$ |
100,397 |
|
|
|
24.6 |
% |
|
$ |
81,621 |
|
|
|
22.9 |
% |
|
EMEA |
|
|
29,974 |
|
|
|
16.4 |
|
|
|
26,768 |
|
|
|
15.4 |
|
|
|
27,854 |
|
|
|
19.0 |
|
|
Asia Pacific |
|
|
24,364 |
|
|
|
23.4 |
|
|
|
18,425 |
|
|
|
19.1 |
|
|
|
8,580 |
|
|
|
10.7 |
|
|
Latin America |
|
|
3,998 |
|
|
|
12.5 |
|
|
|
4,022 |
|
|
|
13.1 |
|
|
|
6,268 |
|
|
|
18.2 |
|
|
Total Executive Search |
|
|
179,090 |
|
|
|
23.1 |
|
|
|
149,612 |
|
|
|
21.1 |
|
|
|
124,323 |
|
|
|
20.1 |
|
|
Advisory |
|
|
5,617 |
|
|
|
0.7 |
|
|
|
100,535 |
|
|
|
12.8 |
|
|
|
47,429 |
|
|
|
6.5 |
|
|
RPO & Professional Search |
|
|
50,884 |
|
|
|
15.4 |
|
|
|
39,396 |
|
|
|
14.4 |
|
|
|
29,995 |
|
|
|
13.4 |
|
|
Corporate |
|
|
(94,765 |
) |
|
|
|
|
|
|
(81,097 |
) |
|
|
|
|
|
|
(81,459 |
) |
|
|
|
|
|
Total operating income |
|
$ |
140,826 |
|
|
|
7.3 |
% |
|
$ |
208,446 |
|
|
|
11.8 |
% |
|
$ |
120,288 |
|
|
|
7.7 |
% |
|
(1) |
Margin calculated as a percentage of fee revenue by segment. |
34
|
|
|
Year Ended April 30, 2019 |
|
|||||||||||||||||||||||||||||||||
|
|
|
Executive Search |
|
|
|
|
|
|
|
|
|
|
|
|
|
|
|
|
|
|||||||||||||||||
|
|
|
North America |
|
|
EMEA |
|
|
Asia Pacific |
|
|
Latin America |
|
|
Subtotal |
|
|
Advisory |
|
|
RPO & Professional Search |
|
|
Corporate |
|
|
Consolidated |
|
|||||||||
|
|
|
(in thousands) |
|
|||||||||||||||||||||||||||||||||
|
Fee revenue |
|
$ |
455,826 |
|
|
$ |
182,829 |
|
|
$ |
104,291 |
|
|
$ |
31,896 |
|
|
$ |
774,842 |
|
|
$ |
821,048 |
|
|
$ |
330,143 |
|
|
$ |
— |
|
|
$ |
1,926,033 |
|
|
Total revenue |
|
$ |
469,743 |
|
|
$ |
186,131 |
|
|
$ |
105,543 |
|
|
$ |
31,960 |
|
|
$ |
793,377 |
|
|
$ |
838,620 |
|
|
$ |
341,865 |
|
|
$ |
— |
|
|
$ |
1,973,862 |
|
|
|
|
|
|
|
|
|
|
|
|
|
|
|
|
|
|
|
|
|
|
|
|
|
|
|
|
|
|
|
|
|
|
|
|
|
|
|
|
Net income attributable to Korn Ferry |
|
|
|
|
|
|
|
|
|
|
|
|
|
|
|
|
|
|
|
|
|
|
|
|
|
|
|
|
|
|
|
|
|
$ |
102,651 |
|
|
Net income attributable to noncontrolling interest |
|
|
|
|
|
|
|
|
|
|
|
|
|
|
|
|
|
|
|
|
|
|
|
|
|
|
|
|
|
|
|
|
|
|
2,145 |
|
|
Other income, net |
|
|
|
|
|
|
|
|
|
|
|
|
|
|
|
|
|
|
|
|
|
|
|
|
|
|
|
|
|
|
|
|
|
|
(10,094 |
) |
|
Interest expense, net |
|
|
|
|
|
|
|
|
|
|
|
|
|
|
|
|
|
|
|
|
|
|
|
|
|
|
|
|
|
|
|
|
|
|
16,891 |
|
|
Equity in earnings of unconsolidated subsidiaries, net |
|
|
|
|
|
|
|
|
|
|
|
|
|
|
|
|
|
|
|
|
|
|
|
|
|
|
|
|
|
|
|
|
|
|
(311 |
) |
|
Income tax provision |
|
|
|
|
|
|
|
|
|
|
|
|
|
|
|
|
|
|
|
|
|
|
|
|
|
|
|
|
|
|
|
|
|
|
29,544 |
|
|
Operating income (loss) |
|
$ |
120,754 |
|
|
$ |
29,974 |
|
|
$ |
24,364 |
|
|
$ |
3,998 |
|
|
$ |
179,090 |
|
|
$ |
5,617 |
|
|
$ |
50,884 |
|
|
$ |
(94,765 |
) |
|
$ |
140,826 |
|
|
Depreciation and amortization |
|
|
3,890 |
|
|
|
1,254 |
|
|
|
1,428 |
|
|
|
410 |
|
|
|
6,982 |
|
|
|
29,057 |
|
|
|
3,255 |
|
|
|
7,195 |
|
|
|
46,489 |
|
|
Other income (loss), net |
|
|
6,388 |
|
|
|
432 |
|
|
|
281 |
|
|
|
322 |
|
|
|
7,423 |
|
|
|
3,198 |
|
|
|
268 |
|
|
|
(795 |
) |
|
|
10,094 |
|
|
Equity in earnings of unconsolidated subsidiaries, net |
|
|
311 |
|
|
|
— |
|
|
|
— |
|
|
|
— |
|
|
|
311 |
|
|
|
— |
|
|
|
— |
|
|
|
— |
|
|
|
311 |
|
|
EBITDA |
|
|
131,343 |
|
|
|
31,660 |
|
|
|
26,073 |
|
|
|
4,730 |
|
|
|
193,806 |
|
|
|
37,872 |
|
|
|
54,407 |
|
|
|
(88,365 |
) |
|
|
197,720 |
|
|
Integration/acquisition costs |
|
|
— |
|
|
|
— |
|
|
|
— |
|
|
|
— |
|
|
|
— |
|
|
|
6,559 |
|
|
|
— |
|
|
|
187 |
|
|
|
6,746 |
|
|
Tradename write-offs |
|
|
— |
|
|
|
— |
|
|
|
— |
|
|
|
— |
|
|
|
— |
|
|
|
106,555 |
|
|
|
— |
|
|
|
— |
|
|
|
106,555 |
|
|
Adjusted EBITDA |
|
$ |
131,343 |
|
|
$ |
31,660 |
|
|
$ |
26,073 |
|
|
$ |
4,730 |
|
|
$ |
193,806 |
|
|
$ |
150,986 |
|
|
$ |
54,407 |
|
|
$ |
(88,178 |
) |
|
$ |
311,021 |
|
|
Operating margin |
|
|
26.5 |
% |
|
|
16.4 |
% |
|
|
23.4 |
% |
|
|
12.5 |
% |
|
|
23.1 |
% |
|
|
0.7 |
% |
|
|
15.4 |
% |
|
|
|
|
|
|
7.3 |
% |
|
Adjusted EBITDA margin |
|
|
28.8 |
% |
|
|
17.3 |
% |
|
|
25.0 |
% |
|
|
14.8 |
% |
|
|
25.0 |
% |
|
|
18.4 |
% |
|
|
16.5 |
% |
|
|
|
|
|
|
16.1 |
% |
|
|
|
Year Ended April 30, 2018 |
|
|||||||||||||||||||||||||||||||||
|
|
|
Executive Search |
|
|
|
|
|
|
|
|
|
|
|
|
|
|
|
|
|
|||||||||||||||||
|
|
|
North America |
|
|
EMEA |
|
|
Asia Pacific |
|
|
Latin America |
|
|
Subtotal |
|
|
Advisory |
|
|
RPO & Professional Search |
|
|
Corporate |
|
|
Consolidated |
|
|||||||||
|
|
|
(in thousands) |
|
|||||||||||||||||||||||||||||||||
|
Fee revenue |
|
$ |
408,098 |
|
|
$ |
173,725 |
|
|
$ |
96,595 |
|
|
$ |
30,624 |
|
|
$ |
709,042 |
|
|
$ |
785,013 |
|
|
$ |
273,162 |
|
|
$ |
— |
|
|
$ |
1,767,217 |
|
|
Total revenue |
|
$ |
421,260 |
|
|
$ |
177,234 |
|
|
$ |
98,062 |
|
|
$ |
30,717 |
|
|
$ |
727,273 |
|
|
$ |
801,005 |
|
|
$ |
291,241 |
|
|
$ |
— |
|
|
$ |
1,819,519 |
|
|
|
|
|
|
|
|
|
|
|
|
|
|
|
|
|
|
|
|
|
|
|
|
|
|
|
|
|
|
|
|
|
|
|
|
|
|
|
|
Net income attributable to Korn Ferry |
|
|
|
|
|
|
|
|
|
|
|
|
|
|
|
|
|
|
|
|
|
|
|
|
|
|
|
|
|
|
|
|
|
$ |
133,779 |
|
|
Net income attributable to noncontrolling interest |
|
|
|
|
|
|
|
|
|
|
|
|
|
|
|
|
|
|
|
|
|
|
|
|
|
|
|
|
|
|
|
|
|
|
2,118 |
|
|
Other income, net |
|
|
|
|
|
|
|
|
|
|
|
|
|
|
|
|
|
|
|
|
|
|
|
|
|
|
|
|
|
|
|
|
|
|
(11,119 |
) |
|
Interest expense, net |
|
|
|
|
|
|
|
|
|
|
|
|
|
|
|
|
|
|
|
|
|
|
|
|
|
|
|
|
|
|
|
|
|
|
13,832 |
|
|
Equity in earnings of unconsolidated subsidiaries, net |
|
|
|
|
|
|
|
|
|
|
|
|
|
|
|
|
|
|
|
|
|
|
|
|
|
|
|
|
|
|
|
|
|
|
(297 |
) |
|
Income tax provision |
|
|
|
|
|
|
|
|
|
|
|
|
|
|
|
|
|
|
|
|
|
|
|
|
|
|
|
|
|
|
|
|
|
|
70,133 |
|
|
Operating income (loss) |
|
$ |
100,397 |
|
|
$ |
26,768 |
|
|
$ |
18,425 |
|
|
$ |
4,022 |
|
|
$ |
149,612 |
|
|
$ |
100,535 |
|
|
$ |
39,396 |
|
|
$ |
(81,097 |
) |
|
$ |
208,446 |
|
|
Depreciation and amortization |
|
|
3,930 |
|
|
|
1,689 |
|
|
|
1,408 |
|
|
|
455 |
|
|
|
7,482 |
|
|
|
31,527 |
|
|
|
3,054 |
|
|
|
6,525 |
|
|
|
48,588 |
|
|
Other income, net |
|
|
845 |
|
|
|
168 |
|
|
|
373 |
|
|
|
181 |
|
|
|
1,567 |
|
|
|
2,501 |
|
|
|
152 |
|
|
|
6,899 |
|
|
|
11,119 |
|
|
Equity in earnings of unconsolidated subsidiaries, net |
|
|
297 |
|
|
|
— |
|
|
|
— |
|
|
|
— |
|
|
|
297 |
|
|
|
— |
|
|
|
— |
|
|
|
— |
|
|
|
297 |
|
|
EBITDA |
|
|
105,469 |
|
|
|
28,625 |
|
|
|
20,206 |
|
|
|
4,658 |
|
|
|
158,958 |
|
|
|
134,563 |
|
|
|
42,602 |
|
|
|
(67,673 |
) |
|
|
268,450 |
|
|
Restructuring charges (recoveries), net |
|
|
— |
|
|
|
— |
|
|
|
313 |
|
|
|
— |
|
|
|
313 |
|
|
|
(241 |
) |
|
|
6 |
|
|
|
— |
|
|
|
78 |
|
|
Integration/acquisition costs |
|
|
— |
|
|
|
— |
|
|
|
— |
|
|
|
— |
|
|
|
— |
|
|
|
9,151 |
|
|
|
— |
|
|
|
279 |
|
|
|
9,430 |
|
|
Adjusted EBITDA |
|
$ |
105,469 |
|
|
$ |
28,625 |
|
|
$ |
20,519 |
|
|
$ |
4,658 |
|
|
$ |
159,271 |
|
|
$ |
143,473 |
|
|
$ |
42,608 |
|
|
$ |
(67,394 |
) |
|
$ |
277,958 |
|
|
Operating margin |
|
|
24.6 |
% |
|
|
15.4 |
% |
|
|
19.1 |
% |
|
|
13.1 |
% |
|
|
21.1 |
% |
|
|
12.8 |
% |
|
|
14.4 |
% |
|
|
|
|
|
|
11.8 |
% |
|
Adjusted EBITDA margin |
|
|
25.8 |
% |
|
|
16.5 |
% |
|
|
21.2 |
% |
|
|
15.2 |
% |
|
|
22.5 |
% |
|
|
18.3 |
% |
|
|
15.6 |
% |
|
|
|
|
|
|
15.7 |
% |
35
|
|
Year Ended April 30, 2017 |
|
||||||||||||||||||||||||||||||||||
|
|
|
Executive Search |
|
|
|
|
|
|
|
|
|
|
|
|
|
|
|
|
|
|||||||||||||||||
|
|
|
North America |
|
|
EMEA |
|
|
Asia Pacific |
|
|
Latin America |
|
|
Subtotal |
|
|
Advisory |
|
|
RPO & Professional Search |
|
|
Corporate |
|
|
Consolidated |
|
|||||||||
|
|
|
(in thousands) |
|
|||||||||||||||||||||||||||||||||
|
Fee revenue |
|
$ |
356,625 |
|
|
$ |
146,506 |
|
|
$ |
80,169 |
|
|
$ |
34,376 |
|
|
$ |
617,676 |
|
|
$ |
724,186 |
|
|
$ |
223,659 |
|
|
$ |
— |
|
|
$ |
1,565,521 |
|
|
Deferred revenue adjustment due to acquisition |
|
|
— |
|
|
|
— |
|
|
|
— |
|
|
|
— |
|
|
|
— |
|
|
|
3,535 |
|
|
|
— |
|
|
|
— |
|
|
|
3,535 |
|
|
Adjusted fee revenue |
|
$ |
356,625 |
|
|
$ |
146,506 |
|
|
$ |
80,169 |
|
|
$ |
34,376 |
|
|
$ |
617,676 |
|
|
$ |
727,721 |
|
|
$ |
223,659 |
|
|
$ |
— |
|
|
$ |
1,569,056 |
|
|
Total revenue |
|
$ |
369,803 |
|
|
$ |
150,113 |
|
|
$ |
81,744 |
|
|
$ |
34,533 |
|
|
$ |
636,193 |
|
|
$ |
741,533 |
|
|
$ |
243,943 |
|
|
$ |
— |
|
|
$ |
1,621,669 |
|
|
|
|
|
|
|
|
|
|
|
|
|
|
|
|
|
|
|
|
|
|
|
|
|
|
|
|
|
|
|
|
|
|
|
|
|
|
|
|
Net income attributable to Korn Ferry |
|
|
|
|
|
|
|
|
|
|
|
|
|
|
|
|
|
|
|
|
|
|
|
|
|
|
|
|
|
|
|
|
|
$ |
84,181 |
|
|
Net income attributable to noncontrolling interest |
|
|
|
|
|
|
|
|
|
|
|
|
|
|
|
|
|
|
|
|
|
|
|
|
|
|
|
|
|
|
|
|
|
|
3,057 |
|
|
Other income, net |
|
|
|
|
|
|
|
|
|
|
|
|
|
|
|
|
|
|
|
|
|
|
|
|
|
|
|
|
|
|
|
|
|
|
(10,328 |
) |
|
Interest expense, net |
|
|
|
|
|
|
|
|
|
|
|
|
|
|
|
|
|
|
|
|
|
|
|
|
|
|
|
|
|
|
|
|
|
|
14,607 |
|
|
Equity in earnings of unconsolidated subsidiaries, net |
|
|
|
|
|
|
|
|
|
|
|
|
|
|
|
|
|
|
|
|
|
|
|
|
|
|
|
|
|
|
|
|
|
|
(333 |
) |
|
Income tax provision |
|
|
|
|
|
|
|
|
|
|
|
|
|
|
|
|
|
|
|
|
|
|
|
|
|
|
|
|
|
|
|
|
|
|
29,104 |
|
|
Operating income (loss) |
|
$ |
81,621 |
|
|
$ |
27,854 |
|
|
$ |
8,580 |
|
|
$ |
6,268 |
|
|
$ |
124,323 |
|
|
$ |
47,429 |
|
|
$ |
29,995 |
|
|
$ |
(81,459 |
) |
|
$ |
120,288 |
|
|
Depreciation and amortization |
|
|
3,812 |
|
|
|
1,030 |
|
|
|
1,060 |
|
|
|
483 |
|
|
|
6,385 |
|
|
|
32,262 |
|
|
|
2,818 |
|
|
|
5,795 |
|
|
|
47,260 |
|
|
Other income (loss), net |
|
|
844 |
|
|
|
(15 |
) |
|
|
300 |
|
|
|
684 |
|
|
|
1,813 |
|
|
|
1,900 |
|
|
|
(91 |
) |
|
|
6,706 |
|
|
|
10,328 |
|
|
Equity in earnings of unconsolidated subsidiaries, net |
|
|
333 |
|
|
|
— |
|
|
|
— |
|
|
|
— |
|
|
|
333 |
|
|
|
— |
|
|
|
— |
|
|
|
— |
|
|
|
333 |
|
|
EBITDA |
|
|
86,610 |
|
|
|
28,869 |
|
|
|
9,940 |
|
|
|
7,435 |
|
|
|
132,854 |
|
|
|
81,591 |
|
|
|
32,722 |
|
|
|
(68,958 |
) |
|
|
178,209 |
|
|
Restructuring charges, net |
|
|
1,719 |
|
|
|
629 |
|
|
|
1,495 |
|
|
|
773 |
|
|
|
4,616 |
|
|
|
29,663 |
|
|
|
101 |
|
|
|
220 |
|
|
|
34,600 |
|
|
Integration/acquisition costs |
|
|
— |
|
|
|
— |
|
|
|
— |
|
|
|
— |
|
|
|
— |
|
|
|
14,440 |
|
|
|
— |
|
|
|
7,939 |
|
|
|
22,379 |
|
|
Deferred revenue adjustment due to acquisition |
|
|
— |
|
|
|
— |
|
|
|
— |
|
|
|
— |
|
|
|
— |
|
|
|
3,535 |
|
|
|
— |
|
|
|
— |
|
|
|
3,535 |
|
|
Separation costs |
|
|
— |
|
|
|
— |
|
|
|
— |
|
|
|
— |
|
|
|
— |
|
|
|
609 |
|
|
|
— |
|
|
|
— |
|
|
|
609 |
|
|
Adjusted EBITDA |
|
$ |
88,329 |
|
|
$ |
29,498 |
|
|
$ |
11,435 |
|
|
$ |
8,208 |
|
|
$ |
137,470 |
|
|
$ |
129,838 |
|
|
$ |
32,823 |
|
|
$ |
(60,799 |
) |
|
$ |
239,332 |
|
|
Operating margin |
|
|
22.9 |
% |
|
|
19.0 |
% |
|
|
10.7 |
% |
|
|
18.2 |
% |
|
|
20.1 |
% |
|
|
6.5 |
% |
|
|
13.4 |
% |
|
|
|
|
|
|
7.7 |
% |
|
Adjusted EBITDA margin |
|
|
24.8 |
% |
|
|
20.1 |
% |
|
|
14.3 |
% |
|
|
23.9 |
% |
|
|
22.3 |
% |
|
|
17.8 |
% |
|
|
14.7 |
% |
|
|
|
|
|
|
15.3 |
% |
Fiscal 2019 Compared to Fiscal 2018
Fee Revenue
Fee Revenue. Fee revenue increased by $158.8 million, or 9%, to $1,926.0 million in fiscal 2019 compared to $1,767.2 million in fiscal 2018. Exchange rates unfavorably impacted fee revenue by $48.3 million, or 3%, in fiscal 2019 compared to the year-ago period. The increase in fee revenue was attributable to organic growth in all solution areas.
Executive Search. Executive Search reported fee revenue of $774.8 million, an increase of $65.8 million, or 9%, in fiscal 2019 compared to $709.0 million in the year-ago period. As detailed below, Executive Search fee revenue was higher in all regions in fiscal 2019 as compared to fiscal 2018. The higher fee revenue in Executive Search was mainly due to a 6% increase in the number of engagements billed and a 5% increase in the weighted-average fees billed per engagement (calculated using local currency) in fiscal 2019 compared to the year-ago period. Exchange rates unfavorably impacted fee revenue by $14.8 million, or 2%, in fiscal 2019 as compared to the year-ago period.
North America reported fee revenue of $455.8 million, an increase of $47.7 million, or 12%, in fiscal 2019 compared to $408.1 million in the year-ago period. North America’s fee revenue was higher due to a 9% increase in the number of engagements billed and a 3% increase in the weighted-average fees billed per engagement (calculated using local currency) in fiscal 2019 compared to the year-ago period. Technology, industrial and financial services were the main sectors contributing to the increase in fee revenue in fiscal 2019 as compared to the year-ago period. The effect of exchange rates on fee revenue was minimal in fiscal 2019 as compared to the year-ago period.
EMEA reported fee revenue of $182.8 million, an increase of $9.1 million, or 5%, in fiscal 2019 compared to $173.7 million in fiscal 2018. Exchange rates unfavorably impacted fee revenue by $5.7 million, or 3%, in fiscal 2019, compared to the year-ago period. The increase in fee revenue was due to a 5% increase in the number of engagements billed and a 4% increase in the weighted-average fees billed per engagement (calculated using local
36
currency) in fiscal 2019 compared to the year-ago period. The performance in the United Kingdom, Germany, United Arab Emirates, and France were the primary contributors to the increase in fee revenue in fiscal 2019 compared to the year-ago period. In terms of business sectors, financial services, industrial and technology had the largest increase in fee revenue in fiscal 2019 compared to the year-ago period, partially offset by a decrease in fee revenue in the life sciences/healthcare and consumer goods sectors.
Asia Pacific reported fee revenue of $104.3 million, an increase of $7.7 million, or 8%, in fiscal 2019 compared to $96.6 million in fiscal 2018. Exchange rates unfavorably impacted fee revenue by $3.6 million, or 4%, in fiscal 2019, compared to the year-ago period. The increase in fee revenue was due to a 10% increase in the number of engagements billed and a 2% increase in the weighted-average fees billed per engagement (calculated using local currency) in fiscal 2019 compared to the year-ago period. The performance in Hong Kong, Australia, Singapore, and New Zealand were the primary contributors to the increase in fee revenue in fiscal 2019 compared to the year-ago period. Technology, education/non-profit, consumer goods, and financial services were the main sectors contributing to the increase in fee revenue in fiscal 2019 as compared to the year-ago period.
Latin America reported fee revenue of $31.9 million, an increase of $1.3 million, or 4%, in fiscal 2019 compared to $30.6 million in fiscal 2018. Exchange rates unfavorably impacted fee revenue by $4.6 million, or 15%, in fiscal 2019, compared to the year-ago period. The increase in fee revenue was due to higher fee revenue in Peru, Colombia and Brazil in fiscal 2019, compared to the year-ago period. Consumer goods and financial services were the main sectors contributing to the increase in fee revenue in fiscal 2019, compared to the year-ago period, partially offset by a decrease in life sciences/healthcare and industrial sectors.
Advisory. Advisory reported fee revenue of $821.0 million, an increase of $36.0 million, or 5%, in fiscal 2019 compared to $785.0 million in fiscal 2018. Exchange rates unfavorably impacted fee revenue by $24.8 million, or 3%, compared to the year-ago period. Fee revenue from consulting services was higher by $27.8 million in fiscal 2019 compared to the year-ago period, with the remaining increase of $8.2 million generated by our products business.
RPO & Professional Search. RPO & Professional Search reported fee revenue of $330.1 million, an increase of $56.9 million, or 21%, in fiscal 2019 compared to $273.2 million in fiscal 2018. Exchange rates unfavorably impacted fee revenue by $8.7 million, or 3%, compared to the year-ago period. Higher fee revenues in RPO and professional search of $33.0 million and $23.9 million, respectively, drove the increase in fee revenue.
Compensation and Benefits
Compensation and benefits expense increased $112.1 million, or 9%, to $1,311.2 million in fiscal 2019 from $1,199.1 million in fiscal 2018. Exchange rates favorably impacted compensation and benefits by $29.6 million, or 2%, in fiscal 2019 compared to the year-ago period. The increase in compensation and benefits was due to a 10% increase in average headcount, which contributed $41.4 million in higher salaries and related payroll taxes and a $13.5 million increase in amortization of long-term incentive awards. Also contributing to the increase was higher performance-related bonus expense of $36.9 million, higher commission expense of $5.5 million and an increase in the use of outside contractors of $5.5 million all due to the need to service higher fee revenues from increased business. Compensation and benefits expense, as a percentage of fee revenue, was 68% in both fiscal 2019 and 2018.
Executive Search compensation and benefits expense increased by $33.8 million, or 7%, to $502.4 million in fiscal 2019 compared to $468.6 million in fiscal 2018. Exchange rates favorably impacted compensation and benefits by $9.4 million, or 2%, in fiscal 2019 compared to the year-ago period. The increase was due to higher performance-related bonus expense of $17.7 million due to the increase in fee revenue. Also contributing to the increase was a 5% increase in average headcount, which contributed $13.0 million in higher salaries and related payroll taxes, and a $8.2 million increase in amortization of long-term incentive awards in fiscal 2019 compared to the year-ago period. Executive Search compensation and benefits expense, as a percentage of fee revenue, decreased to 65% in fiscal 2019 from 66% in fiscal 2018.
Advisory compensation and benefits expense increased by $26.8 million, or 5%, to $524.1 million in fiscal 2019 from $497.3 million in fiscal 2018. Exchange rates favorably impacted compensation and benefits by $14.2 million, or 3%, in fiscal 2019 compared to the year-ago period. The change was primarily due to $6.4 million in higher performance-related bonus expense, an increase of $5.4 million in commission expense and $2.2 million in outside contractors due to the need to accommodate the growth in fee revenue. The rest of the increase in compensation and benefits expense was due to an increase in amortization of long-term incentive awards of $4.1 million and $2.4 million more in salaries and related payroll taxes resulting from a 2% increase in the average consultant headcount in fiscal 2019 compared to the year-ago period. Advisory compensation and benefits expense, as a percentage of fee revenue, increased to 64% in fiscal 2019 from 63% in the year-ago period.
RPO & Professional Search compensation and benefits expense increased by $41.4 million, or 21%, to $234.6 million in fiscal 2019 from $193.2 million in fiscal 2018. Exchange rates favorably impacted compensation and benefits by $5.9 million, or 3%, in fiscal 2019 compared to the year-ago period. The increase was due to higher
37
salaries and related payroll taxes of $23.9 million resulting from a 32% increase in the average headcount in fiscal 2019 compared to fiscal 2018. The higher average headcount and the $2.3 million increase in the use of outside contractors was primarily driven by the need to service an increase in fee revenue in the RPO business. Also contributing to the increase in compensation and benefits was a higher performance-related bonus expense of $10.7 million. RPO & Professional Search compensation and benefits expense, as a percentage of fee revenue, was 71% in both fiscal 2019 and 2018.
Corporate compensation and benefits expense increased by $10.1 million, or 25%, to $50.1 million in fiscal 2019 from $40.0 million in fiscal 2018. The increase was primarily due to higher performance-related bonus expense, higher salaries and related payroll taxes, an increase in the use of outside contractors, higher stock-based compensation expense and an increase in amortization of long-term incentive awards of $2.0 million, $2.2 million, $1.1 million, $0.9 million and $0.6 million, respectively, in fiscal 2019 compared to the year-ago period. The rest of the increase was due to a change in the cash surrender value (“CSV”) of COLI that increased compensation and benefits expense by $1.6 million in fiscal 2019 compared to the year-ago period.
General and Administrative Expenses
General and administrative expenses increased $114.6 million, or 48%, to $352.0 million in fiscal 2019 compared to $237.4 million in fiscal 2018. Exchange rates favorably impacted general and administrative expenses by $8.3 million, or 3%, in fiscal 2019 compared to the year-ago period. The increase in general and administrative expenses was due to the write-off of tradenames of $106.6 million related to the Plan, an increase of $3.0 million in legal and other professional expenses, higher marketing and business development expenses of $2.4 million and an increase in premise and office expense of $1.2 million in fiscal 2019 as compared to the year-ago period. General and administrative expenses, as a percentage of fee revenue, was 18% in fiscal 2019 as compared to 13% in the year-ago period. Excluding the tradename write-offs, general and administrative expenses as a percentage of fee revenue was 13% in fiscal 2019.
Executive Search general and administrative expenses increased by $4.4 million, or 6%, to $82.1 million in fiscal 2019 from $77.7 million in fiscal 2018. The increase in general and administrative expenses was mainly due to $1.8 million more in premise and office expense and an increase of $0.9 million in legal and other professional expenses. Also contributing to the increase were increases to travel-related expenses and marketing and business development expenses of $1.3 million and $0.7 million, respectively, in order to support the higher fee revenues generated in fiscal 2019 as compared to the year-ago period. Executive Search general and administrative expenses, as a percentage of fee revenue, was 11% in both fiscal 2019 and 2018.
Advisory general and administrative expenses increased by $105.9 million, or 108%, to $204.3 million in fiscal 2019 compared to $98.4 million in the year-ago period. The increase in general and administrative expenses was mainly due to the write-off of tradenames of $106.6 million in fiscal 2019 compared to the year-ago period. Advisory general and administrative expenses, as a percentage of fee revenue, was 25% in fiscal 2019 as compared to 13% in the year-ago period. Excluding the tradename write-offs, general and administrative expenses as a percentage of fee revenue was 12% in fiscal 2019.
RPO & Professional Search general and administrative expenses increased by $1.4 million, or 5%, to $28.1 million in fiscal 2019 from $26.7 million in fiscal 2018. The increase was due primarily to increases in premise and office expense of $1.1 million, in fiscal 2019 compared to the year-ago period. RPO & Professional Search general and administrative expenses, as a percentage of fee revenue, was 9% in fiscal 2019 compared to 10% in the year-ago period.
Corporate general and administrative expenses increased by $2.9 million, or 8%, to $37.5 million in fiscal 2019 compared to $34.6 million in fiscal 2018. The increase was due primarily to increases in legal and other professional expenses and software licenses of $2.2 million and $1.7 million, respectively, in fiscal 2019 compared to the year-ago period. This was offset by a foreign exchange gain of $1.0 million in fiscal 2019 compared to a foreign exchange loss of $1.2 million in fiscal 2018.
Cost of Services Expense
Cost of services expense consists primarily of non-billable contractor and product costs related to the delivery of various services and products, primarily in RPO & Professional Search and Advisory. Cost of services expense was $75.5 million in fiscal 2019 compared to $73.7 million in fiscal 2018. Cost of services expense, as a percentage of fee revenue, was 4% in both fiscal 2019 and 2018.
Depreciation and Amortization Expenses
Depreciation and amortization expenses were $46.5 million, a decrease of $2.1 million, or 4%, in fiscal 2019 compared to $48.6 million in fiscal 2018. The decrease was due to lower amortization expense associated with intangible assets as some of our intangible assets became fully amortized.
38
Operating income was $140.8 million, a decrease of $67.6 million, in fiscal 2019 compared to $208.4 million in fiscal 2018. The decrease in operating income was primarily driven by the write-off of tradenames of $106.6 million, an increase of $112.1 million in compensation and benefits expense, and $8.0 million more in general and administrative expenses (excluding write-off of tradenames), offset by higher fee revenue of $158.8 million.
Executive Search operating income increased by $29.5 million, or 20%, to $179.1 million in fiscal 2019 compared to $149.6 million in fiscal 2018. The increase in Executive Search operating income was driven by an increase in fee revenue of $65.8 million, offset by increases in compensation and benefits expense and general and administrative expenses of $33.8 million and $4.4 million, respectively. Executive Search operating income, as a percentage of fee revenue, was 23% and 21% in fiscal 2019 and 2018, respectively.
Advisory operating income was $5.6 million, a decrease of $94.9 million, or 94% in fiscal 2019 compared to $100.5 million in fiscal 2018. The change was primarily due to the write-off of tradenames of $106.6 million and an increase of $26.8 million in compensation and benefits expense in fiscal 2019 compared to the year-ago period, offset by higher fee revenue of $36.0 million and a decrease in depreciation and amortization expense of $2.5 million. Advisory operating income, as a percentage of fee revenue was 1% in fiscal 2019 compared to 13% in the year-ago period. Excluding the tradename write-offs, operating income as a percentage of fee revenue was 14% in fiscal 2019.
RPO & Professional Search operating income was $50.9 million, an increase of $11.5 million, or 29%, in fiscal 2019 compared to $39.4 million in fiscal 2018. The increase in operating income was driven by higher fee revenue of $56.9 million, offset by increases in compensation and benefits expense, cost of services expense and general and administrative expenses of $41.4 million, $2.4 million and $1.4 million, respectively. RPO & Professional Search operating income, as a percentage of fee revenue, was 15% in fiscal 2019 compared to 14% in the year-ago period.
Net Income Attributable to Korn Ferry
Net income attributable to Korn Ferry decreased by $31.1 million to $102.7 million in fiscal 2019 compared $133.8 million in fiscal 2018. The decrease was primarily driven by higher operating expenses of $221.9 million mainly due to the tradename write-off of $106.6 million and higher compensation and benefits expense of $112.1 million, partially offset by higher total revenue of $154.4 million and a lower income tax provision of $40.6 million compared to the year-ago period. Net income attributable to Korn Ferry, as a percentage of fee revenue, was 5% in fiscal 2019 compared to 8% in the year-ago period.
Adjusted EBITDA
Adjusted EBITDA increased by $33.0 million to $311.0 million in fiscal 2019 compared to $278.0 million in fiscal 2018. This increase was driven by higher fee revenue of $158.8 million, offset by an increases of $114.8 million in compensation and benefits expense (excluding integration costs), $8.0 million in general and administrative expenses (excluding write-off on tradenames), $1.8 million in cost of services and a decrease in other income, net of $1.0 million, primarily due to changes in the fair value of our marketable securities in fiscal 2019 compared to the year-ago period. Adjusted EBITDA, as a percentage of fee revenue, was 16% in both fiscal 2019 and 2018.
Executive Search Adjusted EBITDA increased by $34.5 million, or 22%, to $193.8 million in fiscal 2019 compared to $159.3 million in fiscal 2018. The increase was driven by higher fee revenue of $65.8 million and an increase in other income, net of $5.9 million, primarily due to changes in the fair value of our marketable securities in fiscal 2019 compared to the year-ago period, offset by increases of $33.8 million in compensation and benefits expense, $4.4 million in general and administrative expenses. Executive Search Adjusted EBITDA, as a percentage of fee revenue, was 25% in fiscal 2019 as compared to 22% in the year-ago period.
Advisory Adjusted EBITDA was $151.0 million, an increase of $7.5 million, or 5%, in fiscal 2019 compared to $143.5 million in fiscal 2018. The increase was driven by higher fee revenue of $36.0 million, offset by increases of $29.4 million in compensation and benefits expense (excluding integration costs) in fiscal 2019 compared to the year-ago period. Advisory Adjusted EBITDA, as a percentage of fee revenue, was 18% in both fiscal 2019 and 2018.
RPO & Professional Search Adjusted EBITDA was $54.4 million, an increase of $11.8 million, or 28%, in fiscal 2019 compared to $42.6 million in fiscal 2018. The increase was driven by higher fee revenue of $56.9 million, offset by increases of $41.4 million in compensation and benefits expense, $2.4 million in cost of services and $1.4 million in general and administrative expenses, in fiscal 2019 compared to the year-ago period. RPO & Professional Search Adjusted EBITDA, as a percentage of fee revenue, was 16% in both fiscal 2019 and 2018.
39
Other income, net was $10.1 million in the fiscal 2019 compared to $11.1 million in the year-ago period. The decrease was primarily due to smaller gains in the fair value of our marketable securities in fiscal 2019 compared to the year-ago period.
Interest Expense, Net
Interest expense, net primarily relates to our credit agreement and borrowings under our COLI policies, which was partially offset by interest earned on cash and cash equivalent balances. Interest expense, net was $16.9 million in the fiscal 2019 compared to $13.8 million in the year-ago period.
Income Tax Provision
The provision for income tax was $29.5 million in the fiscal 2019 compared to $70.1 million in the year-ago period. This reflects a 22% and 34% effective tax rate for fiscal 2019 and 2018, respectively. The difference in the effective tax rate is primarily due to the enactment of the Tax Act which reduced the U.S. corporate federal statutory income tax rate from 35% to 21%, as well as the excess tax benefit on stock-based awards that vested in fiscal 2019.
Net Income Attributable to Noncontrolling Interest
Net income attributable to noncontrolling interest represents the portion of a subsidiary’s net earnings that are attributable to shares of such subsidiary not held by Korn Ferry that are included in the consolidated results of operations. Net income attributable to noncontrolling interest was $2.1 million in both fiscal 2019 and 2018.
Fiscal 2018 Compared to Fiscal 2017
Fee Revenue
Fee Revenue. Fee revenue went up by $201.7 million, or 13%, to $1,767.2 million in fiscal 2018 compared to $1,565.5 million in fiscal 2017. Exchange rates favorably impacted fee revenue by $35.3 million, or 2%, in fiscal 2018 compared to the year-ago period. The higher fee revenue was attributable to organic growth in all lines of business.
Executive Search. Executive Search reported fee revenue of $709.0 million, an increase of $91.3 million, or 15%, in fiscal 2018 compared to $617.7 million in the year-ago period. As detailed below, Executive Search fee revenue was higher in North America, EMEA and Asia Pacific, partially offset by lower fee revenue in the Latin America region in fiscal 2018 as compared to fiscal 2017. The higher fee revenue in Executive Search was mainly due to a 9% increase in the number of engagements billed and a 3% increase in the weighted-average fees billed per engagement (calculated using local currency) during fiscal 2018 compared to the year-ago period. Exchange rates favorably impacted fee revenue by $12.3 million, or 2%, in fiscal 2018, compared to the year-ago period.
North America reported fee revenue of $408.1 million, an increase of $51.5 million, or 14%, in fiscal 2018 compared to $356.6 million in the year-ago period. North America’s fee revenue was higher due to an 11% increase in the number of engagements billed and a 3% increase in the weighted-average fees billed per engagement (calculated using local currency) during fiscal 2018 compared to the year-ago period. All business sectors contributed to the growth in fee revenue in fiscal 2018 as compared to fiscal 2017, with industrial, technology and financial services contributing the most. The effect of exchange rates on fee revenue was minimal in fiscal 2018, compared to the year-ago period.
EMEA reported fee revenue of $173.7 million, an increase of $27.2 million, or 19%, in fiscal 2018 compared to $146.5 million in fiscal 2017. The favorable effect of exchange rates on fee revenue was $8.8 million, or 6%, in fiscal 2018, compared to the year-ago period. The increase in fee revenue was due to a 10% increase in the number of engagements billed, partially offset by a 2% decrease in the weighted-average fees billed per engagement (calculated using local currency) during fiscal 2018 compared to the year-ago period. The performance in the United Kingdom, Germany, and France were the primary contributors to the increase in fee revenue in fiscal 2018 compared to the year-ago period. All business sectors contributed to the growth in fee revenue in fiscal 2018 as compared to the year-ago period, with industrial, financial services and consumer goods contributing the most.
Asia Pacific reported fee revenue of $96.6 million, an increase of $16.4 million, or 20%, in fiscal 2018 compared to $80.2 million in fiscal 2017. The increase in fee revenue was due to an 8% increase in the number of engagements billed and an 8% increase in the weighted-average fees billed per engagement (calculated using local currency) in fiscal 2018 compared to the year-ago period. The performance in China, Australia, Singapore, and Japan were the primary contributors to the increase in fee revenue in fiscal 2018 compared to the year-ago period, partially offset by a decrease in fee revenue in New Zealand. All business sectors contributed to the growth in fee revenue in fiscal 2018 as compared to the year-ago period, with financial services, life sciences/healthcare, and technology contributing the most. The favorable effect of exchange rates on fee revenue was $2.3 million, or 3%, compared to the year-ago period.
40
Latin America reported fee revenue of $30.6 million, a decrease of $3.8 million, or 11%, in fiscal 2018 compared to $34.4 million in fiscal 2017. The decrease in fee revenue was due to lower fee revenue in Mexico in fiscal 2018, compared to the year-ago period, partially offset by higher fee revenue in Argentina. Financial services and consumer goods were the main sectors contributing to the decline in fee revenue in fiscal 2018, compared to the year-ago period. The effect of exchange rates on fee revenue was minimal.
Advisory. Advisory reported fee revenue of $785.0 million, an increase of $60.8 million, or 8%, in fiscal 2018 compared to $724.2 million in fiscal 2017. Exchange rates favorably impacted fee revenue by $17.4 million, or 2%, compared to the year-ago period. Fee revenue from consulting services was higher by $42.8 million in fiscal 2018 compared to the year-ago period, with the remaining increase of $18.0 million generated by our products business.
RPO & Professional Search. RPO & Professional Search reported fee revenue of $273.2 million, an increase of $49.5 million, or 22%, in fiscal 2018 compared to $223.7 million in fiscal 2017. Higher fee revenues in RPO and professional search of $33.3 million and $18.1 million, respectively, drove the increase in fee revenue. Exchange rates favorably impacted fee revenue by $5.6 million, or 3%, compared to the year-ago period.
Compensation and Benefits
Compensation and benefits expense increased $133.4 million, or 13%, to $1,199.1 million in fiscal 2018 from $1,065.7 million in fiscal 2017. Exchange rates unfavorably impacted compensation and benefits expenses by $23.0 million, or 2%, in fiscal 2018 compared to the year-ago period. The increase in compensation and benefits was primarily due to a 9% increase in the average consultant headcount, which contributed $80.4 million in higher salaries and related payroll taxes, $9.4 million more in expenses associated with our deferred compensation and retirement plans (includes the increases in the fair value of participants’ accounts) and an increase of $5.8 million in employer insurance costs in fiscal 2018 compared to the year-ago period. The rest of the change was due to $40.8 million increase in performance-related bonus expense mainly due to the increase in fee revenue and $11.3 million increase in amortization of long term incentive awards, offset by a $9.8 million decrease in integration costs and $2.9 million from the change in the cash surrender value (“CSV”) of company owned life insurance (“COLI”) in fiscal 2018 compared to the year-ago period. The change in the CSV of COLI decreased compensation and benefits expense in fiscal 2018 compared to fiscal 2017 due to larger increases in the market value of the underlying investments due to market changes. COLI is held to fund other deferred compensation retirement plans (See Note 6—Deferred Compensation and Retirement Plans, included in the notes to our Consolidated Financial Statements). Compensation and benefits expense, as a percentage of fee revenue, was 68% in both fiscal 2018 and 2017.
Executive Search compensation and benefits expense increased by $59.6 million, or 15%, to $468.6 million in fiscal 2018 compared to $409.0 million in fiscal 2017. The increase was primarily due to higher salary cost and related payroll taxes of $24.8 million due to a 5% increase in average headcount reflecting our continued growth-related investment back into the business. Also contributing to the increase in compensation and benefits expense was a $17.1 million increase in performance related bonus expense compared to the year-ago period, an $8.4 million increase in amortization of long-term incentive awards, and an increase of $4.6 million in expenses associated with our deferred compensation and retirement plans (includes the increases in the fair value of participants’ accounts). The increase in performance related bonus expense was due to a 15% increase in fee revenue in fiscal 2018 compared to the year-ago period. Executive Search compensation and benefits expense, as a percentage of fee revenue, was 66% in both fiscal 2018 and 2017.
Advisory compensation and benefits expense increased $35.3 million, or 8%, to $497.3 million in fiscal 2018 from $462.0 million in fiscal 2017. The change was primarily due to increases in salaries and related payroll taxes of $25.3 million and $4.6 million increase in expenses associated with our deferred compensation and retirement plans (includes the increases in the fair value of participants’ accounts). Also contributing to the increase in compensation and benefits expense was an increase of $10.5 million in performance related bonus expense and $2.8 million more in employer insurance costs, offset by a decrease in integration costs of $6.3 million compared to year-ago period. Advisory compensation and benefits expense, as a percentage of fee revenue, was 63% in fiscal 2018 compared to 64% in the year-ago period.
RPO & Professional Search compensation and benefits expense increased $38.4 million, or 25%, to $193.2 million in fiscal 2018 from $154.8 million in fiscal 2017. The increase was due to higher salaries and related payroll taxes of $26.8 million due to a 20% increase in the average headcount in fiscal 2018 compared to the year-ago period. The higher average headcount was primarily driven by the need to service an increase in fee revenue in both the professional search and RPO businesses. Also contributing to the increase in compensation and benefits expense was an increase of $11.3 million in performance related bonus expense due to a 22% increase in fee revenue in fiscal 2018 compared to the year-ago period. RPO & Professional Search compensation and benefits expense, as a percentage of fee revenue, was 71% in fiscal 2018 compared to 69% in the year-ago period.
Corporate compensation and benefits expense was $40.0 million in fiscal 2018 as compared to $39.9 million in fiscal 2017.
41
General and Administrative Expenses
General and administrative expenses increased $11.2 million, or 5%, to $237.4 million in fiscal 2018 compared to $226.2 million in fiscal 2017. The increase in general and administrative expenses was due to increases of $6.2 million and $2.2 million in legal and other professional fees and premise and office expenses, respectively, offset by a decline of $3.8 million in integration costs during fiscal 2018 compared to the year-ago period. The rest of the change was primarily due to generating foreign exchange loss of $3.3 million during fiscal 2018 compared to a foreign exchange gain of $0.3 million in fiscal 2017. General and administrative expenses, as a percentage of fee revenue, was 13% in fiscal 2018 compared to 14% in fiscal 2017. Exchange rates unfavorably impacted general and administrative expenses by $3.7 million, or 2%, during fiscal 2018 compared to the year-ago period.
Executive Search general and administrative expenses increased $8.0 million, or 11%, to $77.7 million in fiscal 2018 from $69.7 million in fiscal 2017. General and administrative expenses increased due to generating foreign exchange losses of $1.2 million during fiscal 2018 compared to a foreign exchange gain of $1.3 million during the year-ago period and an increase in legal and other professional fees of $0.9 million. The rest of the change was due to an increase in $0.8 million in marketing and business development expenses to support the higher fee revenues generated in fiscal 2018 compared to the year-ago period, $0.7 million increase in premise and office expenses, and an increase in bad debt expense of $0.6 million. Executive Search general and administrative expenses, as a percentage of fee revenue, was 11% in both fiscal 2018 and 2017.
Advisory general and administrative expenses increased $1.3 million to $98.4 million in fiscal 2018 compared to $97.1 million in the year-ago period. General and administrative expenses increased due to a foreign exchange loss of $1.1 million during fiscal 2018 compared to a foreign exchange gain of $0.2 million in fiscal 2017. Advisory general and administrative expenses, as a percentage of fee revenue, was 13% in both fiscal 2018 and 2017.
RPO & Professional Search general and administrative expenses increased $2.8 million, or 12%, to $26.7 million in fiscal 2018 from $23.9 million in fiscal 2017. The increase was due primarily to increases in premise and office expenses, bad debt expense and legal and other professional fees of $1.2 million, $1.0 million and $0.4 million, respectively, in fiscal 2018 compared to the year-ago period. RPO & Professional Search general and administrative expenses, as a percentage of fee revenue, was 10% in fiscal 2018 compared to 11% in fiscal 2017.
Corporate general and administrative expenses decreased $0.9 million, or 3%, to $34.6 million in fiscal 2018 compared to $35.5 million in fiscal 2017. The decrease in general and administrative expenses was due to a decrease of $4.2 million in integration costs associated with the Legacy Hay acquisition and $0.8 million in business development expenses, offset by an increase in legal and other professional fees of $4.3 million during fiscal 2018 compared to fiscal 2017.
Cost of Services Expense
Cost of services expense consists primarily of non-billable contractor and product costs related to the delivery of various services and products, primarily in RPO & Professional Search and Advisory. Cost of services expense was $73.7 million in fiscal 2018 compared to $71.5 million in fiscal 2017. Cost of services expense, as a percentage of fee revenue, was 4% in fiscal 2018 as compared to 5% in the year-ago period.
Depreciation and Amortization Expenses
Depreciation and amortization expenses were $48.6 million, an increase of $1.3 million, in fiscal 2018 compared to $47.3 million in fiscal 2017. The increase relates primarily to technology investments made in the current and prior year in software and computer equipment, in addition to increases in leasehold improvements and furniture and fixtures.
Restructuring Charges, Net
The Company continued the implementation of the fiscal 2016 restructuring plan in fiscal 2017 in order to integrate the Advisory entities that were acquired in fiscal 2016 by eliminating redundant positions and operational, general and administrative expenses and consolidating premises. This resulted in restructuring charges of $34.6 million in fiscal 2017, of which $16.0 million related to severance and $18.6 million related to consolidation of premises. Fiscal 2018 restructuring charges were minimal.
Operating Income
Operating income was $208.4 million, an increase of $88.1 million, in fiscal 2018 as compared to $120.3 million in fiscal 2017. This increase in operating income resulted from higher fee revenue of $201.7 million and a decrease in restructuring charges, net of $34.5 million, offset by increases of $133.4 million in compensation and benefits expense, $11.2 million in general and administrative expenses, $2.2 million in cost of services expense, and $1.3 million in depreciation and amortization expenses.
42
Executive Search operating income increased $25.3 million, or 20%, to $149.6 million in fiscal 2018 as compared to $124.3 million in fiscal 2017. The increase in Executive Search operating income was driven by increases in higher fee revenue of $91.3 million and a decrease in restructuring charges, net of $4.3 million, offset by increases in compensation and benefits expense, general and administrative expenses, cost of services expense and depreciation and amortization expenses of $59.6 million, $8.0 million, $1.6 million and $1.1 million, respectively. Executive Search operating income, as a percentage of fee revenue, was 21% in fiscal 2018 as compared to 20% in the year-ago period.
Advisory operating income was $100.5 million, an increase of $53.1 million, or 112%, in fiscal 2018 as compared to operating income of $47.4 million in fiscal 2017. The increase was primarily driven by an increase in fee revenue of $60.8 million and a decrease in restructuring charges, net of $29.9 million, offset by an increase of $35.3 million in compensation and benefits expense, $1.8 million in cost of services expense, and $1.3 million in general and administrative expenses in fiscal 2018 compared to the year-ago period. Advisory operating income, as a percentage of fee revenue, was 13% in fiscal 2018 compared to 7% in the year-ago period.
RPO & Professional Search operating income was $39.4 million, an increase of $9.4 million, in fiscal 2018 as compared to $30.0 million in fiscal 2017. The increase in operating income was driven by higher fee revenue of $49.5 million, offset by an increase in compensation and benefits expense of $38.4 million and general and administrative expenses of $2.8 million. RPO & Professional Search operating income, as a percentage of fee revenue, was 14% in fiscal 2018 compared to 13% in the year-ago period.
Net Income Attributable to Korn Ferry
Net income attributable to Korn Ferry increased by $49.6 million to $133.8 million in fiscal 2018 compared to $84.2 million in fiscal 2017. The increase was due to higher total revenue of $197.8 million, offset by higher operating expenses of $109.6 million and an increase in income tax provision of $41.0 million partially due to the enactment of the Tax Act compared to the year-ago period. Net income attributable to Korn Ferry, as a percentage of fee revenue, was 8% in fiscal 2018 as compared to 5% in the year-ago period.
Adjusted EBITDA
Adjusted EBITDA increased by $38.7 million, or 16% to $278.0 million in fiscal 2018 as compared to $239.3 million in fiscal 2017. This increase was driven by higher adjusted fee revenue of $198.1 million, offset by increases of $143.2 million in compensation and benefits expense (excluding integration costs), $14.9 million in general and administrative expenses (excluding integration costs) and $2.2 million in cost of services expense compared to the year-ago period. Adjusted EBITDA, as a percentage of adjusted fee revenue, was 16% in fiscal 2018 compared to 15% in the year-ago period.
Executive Search Adjusted EBITDA increased $21.8 million, or 16%, to $159.3 million in fiscal 2018 as compared to $137.5 million in fiscal 2017. The increase was driven by higher fee revenue of $91.3 million, offset by increases of $59.6 million in compensation and benefits expense, $8.0 million in general and administrative expenses, and an increase in cost of services expense of $1.6 million during fiscal 2018 compared to the year-ago period. Executive Search Adjusted EBITDA, as a percentage of fee revenue, was 22% in both fiscal 2018 and 2017.
Advisory Adjusted EBITDA was $143.5 million, an increase of $13.7 million, or 11%, in fiscal 2018 as compared to $129.8 million in fiscal 2017. The increase was driven by higher adjusted fee revenue of $57.3 million, offset by increases of $41.6 million in compensation and benefits expense (excluding integration costs), $0.9 million in general and administrative expenses (excluding integration costs), and an increase in cost of services expense of $1.8 million during fiscal 2018 compared to the year-ago period. Advisory Adjusted EBITDA, as a percentage of adjusted fee revenue, was 18% in both fiscal 2018 and 2017.
RPO & Professional Search Adjusted EBITDA was $42.6 million in fiscal 2018, an increase of $9.8 million, or 30%, as compared to $32.8 million in fiscal 2017. The increase was driven by higher fee revenue of $49.5 million, offset by increases of $38.4 million in compensation and benefits expense and $2.8 million in general and administrative expenses during fiscal 2018 compared to the year-ago period. RPO & Professional Search Adjusted EBITDA, as a percentage of fee revenue, was 16% in fiscal 2018 compared to 15% in the year-ago period.
Other Income (Loss), Net
Other income, net was $11.1 million in fiscal 2018 as compared to $10.3 million in fiscal 2017. The increase was primarily due to a smaller amount of losses associated with our deferred compensation and retirement plans, offset by the change in the fair value of our marketable securities, where there was a smaller gain during fiscal 2018 compared to the year-ago period.
43
Interest (Expense) Income, Net
Interest (expense) income, net primarily relates to our term loan facility and borrowings under our COLI policies, which was partially offset by interest earned on cash and cash equivalent balances. Interest expense, net was $13.8 million in fiscal 2018 as compared to $14.6 million in fiscal 2017.
Income Tax Provision
The provision for income tax was $70.1 million in fiscal 2018 compared to $29.1 million in the year-ago period. This reflects a 34% and 25% effective tax rate for fiscal 2018 and 2017, respectively. In fiscal 2018 the effective tax rate was significantly impacted by the December 22, 2017 enactment of the Tax Act as a result of which, Korn Ferry recorded a provisional tax charge of $18.4 million as a one-time tax on accumulated foreign earnings (the “Transition Tax”), and a provisional tax benefit of $5.9 million from the remeasurement of our U.S. federal deferred tax assets and liabilities.
Net Income Attributable to Noncontrolling Interest
Net income attributable to noncontrolling interest represents the portion of a subsidiary’s net earnings that are attributable to shares of such subsidiary not held by Korn Ferry that are included in the consolidated results of operations. Net income attributable to noncontrolling interest for fiscal 2018 and 2017 was $2.1 million compared to $3.1 million, respectively.
Liquidity and Capital Resources
The Company and its Board of Directors endorse a balanced approach to capital allocation. The Company’s priority is to invest in growth initiatives, such as the hiring of consultants, the continued development of IP and derivative products and services, and the investment in synergistic, accretive merger and acquisition transactions that earn a return that is superior to the Company's cost of capital. Next, the Company’s capital allocation approach contemplates the return of a portion of excess capital to stockholders, in the form of a regular quarterly dividend, subject to the factors discussed below and in the “Risk Factors” section of this Annual Report on Form 10-K. Additionally, the Company considers share repurchases on an opportunistic basis and subject to the terms of our Credit Agreement (defined below).
On December 19, 2018, we entered into a senior secured $650.0 million Amended and Restated Credit Agreement (the “Credit Agreement”) with a syndicate of banks and Wells Fargo Bank, National Association as administrative agent to among other things, provide for enhanced financial flexibility. See Note 10—Long-Term Debt for a description of the Credit Agreement. We drew down $226.9 million on the Revolver (defined below) and used the proceeds to pay-off the term loan that was outstanding as of December 19, 2018. We have $420.2 million available under the Revolver after the draw down and after $2.9 million of standby letters of credit were issued as of April 30, 2019. We had $2.9 million in standby letters of credit issued under our long-term debt arrangements as of April 30, 2019 and 2018, respectively. We had a total of $8.5 million and $7.4 million of standby letters of credits with other financial institutions as of April 30, 2019 and 2018, respectively. The standby letters of credits were generally issued as a result of entering into office premise leases.
As part of a previous acquisition, the Company committed to a $40 million retention pool for certain employees of the previous acquired company subject to certain circumstances. The balance was paid in full as of January 31, 2019.
The Board of Directors has adopted a dividend policy to distribute, to our stockholders, a regular quarterly cash dividend of $0.10 per share. Every quarter since the adoption of the dividend policy, the Company has declared a quarterly dividend. The declaration and payment of future dividends under the quarterly dividend program will be at the discretion of the Board of Directors and will depend upon many factors, including our earnings, capital requirements, financial conditions, the terms of our indebtedness and other factors our Board of Directors may deem to be relevant. Our Board of Directors may, however, amend, revoke or suspend our dividend policy at any time and for any reason.
On March 6, 2019, our Board of Directors approved an increase to the share repurchase program of approximately $200 million, which brings our available capacity to repurchase shares in the open market or privately negotiated transactions to approximately $250 million. The Company repurchased approximately $37.4 million and $33.1 million of the Company’s stock during fiscal 2019 and 2018, respectively. Any decision to continue to execute our currently outstanding share repurchase program will depend on our earnings, capital requirements, financial condition and other factors considered relevant by our Board of Directors. The Credit Agreement permits us to pay dividends to our stockholders and make share repurchases so long as our pro forma net leverage ratio, defined as the ratio of consolidated funded indebtedness minus up to $50 million of unrestricted cash and cash equivalents of the Company and domestic subsidiaries to consolidated Adjusted EBITDA, is no greater than 3.25 to 1.00, and our pro forma domestic liquidity is at least $50 million, including the revolving credit commitment minus amounts outstanding on the Revolver, issued letters of credit and swing loans.
44
Our performance is subject to the general level of economic activity in the geographic regions and the industries we service. We believe, based on current economic conditions, that our cash on hand and funds from operations and the Credit Agreement will be sufficient to meet anticipated working capital, capital expenditures, general corporate requirements, repayment of the debt, share repurchases and dividend payments under our dividend policy during the next twelve months. However, if the national or global economy, credit market conditions and/or labor markets were to deteriorate in the future, such changes could put negative pressure on demand for our services and affect our operating cash flows. If these conditions were to persist over an extended period of time, we may incur negative cash flows and it might require us to access our existing credit facility to meet our capital needs and/or discontinue our share repurchases and dividend policy.
Cash and cash equivalents and marketable securities were $767.1 million and $657.9 million as of April 30, 2019 and 2018, respectively. Net of amounts held in trust for deferred compensation plans and accrued bonuses, cash and marketable securities were $382.1 million and $312.4 million at April 30, 2019 and 2018, respectively. As of April 30, 2019 and 2018, we held $267.0 million and $207.6 million, respectively of cash and cash equivalents in foreign locations, net of amounts held in trust for deferred compensation plans and to pay fiscal 2019 annual bonuses. Cash and cash equivalents consist of cash and highly liquid investments purchased with original maturities of three months or less. Marketable securities consist of mutual funds. The primary objective of our investment in mutual funds is to meet the obligations under certain of our deferred compensation plans.
As of April 30, 2019 and 2018, marketable securities of $140.8 million (net of gross unrealized gains of $6.3 million and gross unrealized losses of $1.0 million) and $137.1 million (net of gross unrealized gains of $11.0 million and gross unrealized losses of $1.0 million), respectively, were held in trust for settlement of our obligations under certain deferred compensation plans, of which $132.5 million and $122.8 million, respectively, are classified as non-current. These marketable securities were held to satisfy vested obligations totaling $122.3 million and $118.2 million as of April 30, 2019 and 2018, respectively. Unvested obligations under the deferred compensation plans totaled $24.6 million and $29.5 million as of April 30, 2019 and 2018, respectively.
The net increase in our working capital of $130.1 million as of April 30, 2019 compared to April 30, 2018 is primarily attributable to increases in cash and cash equivalents and accounts receivable and a decrease in the current portion of our long-term debt, partially offset by an increase in compensation and benefits payable. The increase in cash and cash equivalents is due to cash provided by operations. Accounts receivable and compensation and benefits payable increased due to a $158.8 million increase in fee revenue and higher average headcount. The decrease in the current portion of our long-term debt is a result of the amount withdrawn on the Revolver to pay off the prior term loan. Cash provided by operating activities was $258.8 million in fiscal 2019, an increase of $39.7 million, compared to $219.1 million in fiscal 2018.
Cash used in investing activities was $69.5 million in fiscal 2019 compared to $44.8 million in fiscal 2018. An increase in cash used in investing activities was primarily due to an increase in premiums paid under our COLI contracts and higher cash used for the purchases of property and equipment, offset by an increase in the proceeds from sales/maturities of marketable securities, net of cash used to purchase marketable securities in fiscal 2019 compared to the year-ago period.
Cash used in financing activities was $64.6 million in fiscal 2019 compared to $77.3 million in fiscal 2018. The decrease was primarily due to $226.9 million in proceeds received from the Credit Agreement and borrowings of $31.9 million from our COLI contracts, partially offset by an increase in payments made on the term loan of $218.3 million and increases in cash used to repurchase shares of common stock to satisfy tax withholding requirements upon the vesting of restricted stock of $16.9 million, $4.3 million in shares repurchased under the stock repurchase program and an increase in payments on life insurance policy loans of $4.8 million in fiscal 2019 compared to the year-ago period.
Off-Balance Sheet Arrangements
We have no off-balance sheet arrangements and have not entered into any transactions involving unconsolidated, special purpose entities.
45
Contractual obligations represent future cash commitments and liabilities under agreements with third parties and exclude contingent liabilities for which we cannot reasonably predict future payment. The following table represents our contractual obligations as of April 30, 2019:
|
|
|
|
|
|
|
Payments Due in: |
|
|||||||||||||||||
|
|
|
Note (1) |
|
|
Total |
|
|
Less Than 1 Year |
|
|
1-3 Years |
|
|
3-5 Years |
|
|
More Than 5 Years |
|
||||||
|
|
|
|
|
|
|
(in thousands) |
|
|||||||||||||||||
|
Operating lease commitments |
|
|
14 |
|
|
$ |
300,737 |
|
|
$ |
55,351 |
|
|
$ |
98,032 |
|
|
$ |
72,590 |
|
|
$ |
74,764 |
|
|
Interest payments on COLI loans (2) |
|
|
10 |
|
|
|
49,265 |
|
|
|
5,237 |
|
|
|
10,469 |
|
|
|
10,435 |
|
|
|
23,124 |
|
|
Long-term debt |
|
|
10 |
|
|
|
226,875 |
|
|
|
— |
|
|
|
— |
|
|
|
226,875 |
|
|
|
— |
|
|
Estimated interest on long-term debt (3) |
|
|
— |
|
|
|
39,854 |
|
|
|
8,611 |
|
|
|
17,174 |
|
|
|
14,069 |
|
|
|
— |
|
|
Total |
|
|
|
|
|
$ |
616,731 |
|
|
$ |
69,199 |
|
|
$ |
125,675 |
|
|
$ |
323,969 |
|
|
$ |
97,888 |
|
|
(1) |
See the corresponding Note in the accompanying consolidated financial statements in Item 15. |
|
(2) |
Assumes COLI loans remain outstanding until receipt of death benefits on COLI policies and applies current interest rates on COLI loans ranging from 4.76% to 8.00% with total death benefits payable, net of loans under COLI contracts of $223.6 million at April 30, 2019. |
|
(3) |
Interest rate used is the variable rate per the credit agreement as of April 30, 2019 for outstanding balances on the long-term debt. |
In addition to the contractual obligations above, we have liabilities related to certain employee benefit plans. These liabilities are recorded in our consolidated balance sheets. The obligations related to these employee benefit plans are described in Note 6—Deferred Compensation and Retirement Plans, in the Notes to our Consolidated Financial Statements in this Annual Report on Form 10-K.
Lastly, we have contingent commitments under certain employment agreements that are payable upon involuntary termination without cause, as described in Note 14—Commitments and Contingencies, in the Notes to our Consolidated Financial Statements in this Annual Report on Form 10-K.
Cash Surrender Value of Company Owned Life Insurance Policies, Net of Loans
We purchased COLI policies or contracts insuring the lives of certain employees eligible to participate in the deferred compensation and pension plans as a means of funding benefits under such plans. As of April 30, 2019 and 2018, we held contracts with gross CSV of $219.2 million and $186.8 million, respectively. Total outstanding borrowings against the CSV of COLI contracts were $93.2 million and $66.7 million as of April 30, 2019 and 2018, respectively. Such borrowings do not require annual principal repayments, bear interest primarily at variable rates and are secured by the CSV of COLI contracts. At April 30, 2019 and 2018, the net cash value of these policies was $126.0 million and $120.1 million, respectively. Total death benefits payable, net of loans under COLI contracts, were $223.6 million and $226.0 million at April 30, 2019 and 2018, respectively.
Long-Term Debt
On December 19, 2018, we entered into the Credit Agreement to among other things, provide for enhanced financial flexibility. The Credit Agreement provides for, among other things: (a) a $650.0 million five-year senior secured revolving credit facility (the “Revolver”) and (b) certain customary affirmative and negative covenants, including a maximum consolidated total leverage ratio (as defined below) and a minimum interest coverage ratio. Our Credit Agreement permits payment of dividends to stockholders and share repurchases so long as the pro forma net leverage ratio is no greater than 3.25 to 1.00, and the pro forma domestic liquidity is at least $50.0 million. We drew down $226.9 million on the Revolver and used the proceeds to pay-off the term loan that was outstanding as of December 19, 2018. The pay-off of the old credit facility and drawn-down on the new Revolver is considered a debt modification and therefore the previously incurred unamortized and current debt issuance costs will be amortized over the life of the new issuance.
At our option, loans issued under the Credit Agreement will bear interest at either LIBOR or an alternate base rate, in each case plus the applicable interest rate margin. The interest rate applicable to loans outstanding under the Credit Agreement may fluctuate between LIBOR plus 1.25% per annum to LIBOR plus 2.00% per annum, in the case of LIBOR borrowings (or between the alternate base rate plus 0.25% per annum and the alternate base rate plus 1.00% per annum, in the alternative), based upon the Company’s total funded debt to Adjusted EBITDA ratio (as set forth in the Credit Agreement, the “consolidated leverage ratio”) at such time. In addition, the Company will be required to pay to the lenders a quarterly commitment fee ranging from 0.20% to 0.35% per annum on the average daily unused amount of the Revolver, based upon the Company’s consolidated leverage ratio at such time, and fees relating to the issuance of letters of credit. During fiscal 2019 and 2018, the average rate on our long-term debt arrangements was 3.50% and 2.60%, respectively.
46
The Revolver matures on December 19, 2023 and any unpaid principal balance is payable on this date. The Revolver may also be prepaid and terminated early by us at any time without premium or penalty (subject to customary LIBOR breakage fees). As of April 30, 2019, $226.9 million was outstanding under the Revolver compared to $238.9 million as of April 30, 2018, under the previous term loan. The unamortized debt issuance costs associated with the long-term debt, were $4.0 million and $2.7 million as of April 30, 2019 and 2018, respectively. The fair value of our Revolver is based on borrowing rates currently required of loans with similar terms, maturity and credit risk. The carrying amount of the Revolver approximates fair value because the base interest rate charged varies with market conditions and the credit spread is commensurate with current market spreads for issuers of similar risk. The fair value of the Revolver is classified as a Level 2 liability in the fair value hierarchy. As of April 30, 2019, we were in compliance with our debt covenants.
We had a total of $420.2 million available under the Revolver after we drew down $226.9 million and after $2.9 million of standby letters of credit were issued as of April 30, 2019. As of April 30, 2018, we had no borrowings under the previous revolver. We had a total of $122.1 million available under the previous revolver after $2.9 million of standby letters of credit were issued as of April 30, 2018. We had a total of $8.5 million and $7.4 million of standby letters of credits with other financial institutions as of April 30, 2019 and 2018, respectively. The standby letters of credits were generally issued as a result of entering into office premise leases.
We are not aware of any other trends, demands or commitments that would materially affect liquidity or those that relate to our resources.
Accounting Developments
Recently Adopted Accounting Standards
In May 2014, the Financial Accounting Standards Board (“FASB”) issued Accounting Standards Codification (“ASC”) 606, which superseded revenue recognition requirements regarding contracts with customers to transfer goods or services or for the transfer of nonfinancial assets. Under this guidance, entities are required to recognize revenue that depicts the transfer of promised goods or services to customers in an amount that reflects the consideration to which the entity expects to be entitled in exchange for those goods or services. The transfer is considered to occur when the customer obtains control of the goods or services delivered. The guidance provides a five-step analysis to be performed on transactions to determine when and how revenue is recognized. The new guidance became effective for fiscal years and interim periods within those annual years beginning after December 15, 2017. We adopted ASC 606 in fiscal year beginning May 1, 2018 using the modified retrospective transition method with respect to those contracts still outstanding and not completed as of May 1, 2018.
We recognized the cumulative effect of initially applying the new guidance as an adjustment to the opening balance of retained earnings. The comparative periods have not been restated and continue to be reported under the revenue accounting standards in effect for those periods. As a result of the adoption, we recorded an increase to retained earnings of $6.7 million, net of tax as of May 1, 2018 due to the cumulative impact of adopting ASC 606. The change in total assets was recorded to unbilled receivables which is included in receivables due from clients; the changes in total liabilities was recorded to income taxes payable, deferred tax liabilities and deferred revenue, which is included in other accrued liabilities.
The following table summarizes the effect of changes made to our consolidated balance sheet at May 1, 2018:
|
|
|
|
|
|
|
Adjustments |
|
|
|
|
|
|
|
|
|
April 30, 2018 |
|
|
due to ASC 606 |
|
|
May 1, 2018 |
|
|||
|
|
|
(in thousands) |
|
|||||||||
|
Total assets |
|
$ |
2,287,914 |
|
|
$ |
3,496 |
|
|
$ |
2,291,410 |
|
|
Total liabilities |
|
$ |
1,068,299 |
|
|
$ |
(3,160 |
) |
|
$ |
1,065,139 |
|
|
Total stockholders’ equity |
|
$ |
1,219,615 |
|
|
$ |
6,656 |
|
|
$ |
1,226,271 |
|
The adjustments primarily relate to uptick revenue (uptick revenue occurs when a placement’s actual compensation is higher than the original estimated compensation) and certain Korn Ferry products that are now considered Functional IP. Under the new standard, uptick revenue is considered variable consideration and estimated at contract inception using the expected value method and recognized over the service period. Previously, we recognized uptick revenue as the amount became fixed or determinable. Under the new standard, certain products are now considered Functional IP as delivery of IP content fulfills the performance obligation, and revenue is recognized upon delivery and when an enforceable right to payment exists. Previously these products were considered term licenses and revenue was recognized ratably over the contract term.
47
In August 2016, the FASB issued guidance on the classification of certain cash receipts and cash payments in the statement of cash flows. The new guidance provides clarification on specific cash flow issues regarding presentation and classification in the statement of cash flows with the objective of reducing the existing diversity in practice. The amendments in this update are effective for reporting periods beginning after December 15, 2017 and were adopted by us effective May 1, 2018. The adoption of this guidance did not have an impact on our consolidated financial statements.
In January 2017, the FASB issued guidance that clarifies the definition of a business. The new guidance assists a company when evaluating whether transactions should be accounted for as acquisitions (disposals) of assets or businesses. The provisions of the guidance require that if the fair value of the gross assets acquired (or disposed of) is substantially concentrated in a single identifiable asset or a group of similar identifiable assets, then it is not a business. The provisions of the guidance are to be applied prospectively. The provisions of the guidance are effective for annual years beginning after December 15, 2017 and were adopted by us effective May 1, 2018. The adoption of this guidance did not have an impact on our consolidated financial statements.
In March 2017, the FASB issued guidance that changes the presentation of net periodic pension cost and net periodic postretirement benefit cost. The new guidance will change the presentation of net periodic benefit cost related to employer-sponsored defined benefit plans and other postretirement benefits. Service cost will be included within the same income statement line item as other compensation costs arising from services rendered during the period, while other components of net periodic benefit pension cost will be presented separately outside of operating income. Additionally, only service costs may be capitalized in assets. This pronouncement is effective for annual reporting periods beginning after December 15, 2017 and was adopted by us effective May 1, 2018. The change to the consolidated statements of income has been reflected on a retrospective basis and had no effect on net income. Prior period amounts were revised, which resulted in a decrease in compensation expense and other income of $4.6 million and $0.4 million, respectively, and an increase in interest expense of $4.2 million, in fiscal 2018. For fiscal 2017, this resulted in a decrease in compensation expense and other income of $5.8 million and $1.5 million, respectively, and an increase in interest expense of $4.4 million.
In May 2017, the FASB issued guidance clarifying the scope of modification accounting for stock compensation. The new standard provides guidance about which changes to the terms or conditions of a share-based payment award require an entity to apply modification accounting in Topic 718. This pronouncement is effective for annual reporting periods beginning after December 15, 2017 and was adopted by us effective May 1, 2018. The adoption of this guidance did not have an impact on our consolidated financial statements. Any future impact of this guidance will be dependent on future modification including the number of awards modified.
In February 2018, the FASB issued guidance that provides companies the option to reclassify stranded tax effects from accumulated other comprehensive (loss) income to retained earnings. The new guidance requires companies to disclose whether they decided to reclassify the income tax effects of the Tax Act from accumulated other comprehensive income (loss) to retained earnings. The guidance is effective for annual reporting periods beginning after December 15, 2018, but early adoption is permitted. We early adopted effective May 1, 2018, upon the adoption of this guidance we recorded an increase of $2.2 million to retained earnings due to the reclassification from accumulated other comprehensive (loss) income to retained earnings in the period of adoption.
In August 2018, the FASB issued guidance amending and modifying the disclosure requirements for employers that sponsor defined benefit pension or other postretirement pension plans. The amendment removes disclosures to pension plans and other postretirement benefit plans that are no longer considered beneficial and adds disclosure requirements deemed relevant. The amendments of this standard are effective for fiscal years ending after December 15, 2020 with early adoption permitted. We early adopted this standard in the fourth quarter of fiscal 2019. The adoption of this guidance did not have an impact on our consolidated financial statements.
Recently Proposed Accounting Standards - Not Yet Adopted
In February 2016, the FASB issued guidance on accounting for leases that generally requires all leases to be recognized on the consolidated balance sheet. The provisions of the guidance are effective for fiscal years beginning after December 15, 2018 and early adoption is permitted. We plan to adopt this guidance in fiscal year beginning May 1, 2019. The provisions of the guidance are to be applied using a modified retrospective approach. On July 30, 2018, the FASB issued an amendment that allows entities to apply the provisions at the effective date without adjusting comparative periods. The FASB has also issued subsequent related ASUs, which detail amendments to the ASU, implementation considerations, narrow-scope improvements and practical expedients. We have elected to apply the group of practical expedients which allows us to carry forward its identification of contracts that are or contain leases, its historical lease classification and its initial direct costs for existing leases. We also elected to combine lease and non-lease components for all asset classes and to recognize leases with an initial term of 12 months on a straight-line basis without recognizing a right-to-use asset or operating lease liability. We are in the process of finalizing the data validation and associated internal controls for our selected global lease management system. We currently
48
estimate that the adoption of this standard will result in the recording of a material right-of-use asset and a material operating lease liability, as well as enhanced disclosures. We do not expect the adoption of this standard to have an impact on our consolidated statements of income, consolidated statements of stockholders’ equity, or consolidated statements of cash flows.
In June 2016, the FASB issued guidance on accounting for measurement of credit losses on financial Instruments, which amends the impairment model by requiring entities to use a forward-looking approach based on expected losses to estimate credit losses on certain types of financial instruments, including trade receivables. The standard is effective for fiscal years beginning after December 15, 2019. We will adopt this guidance in fiscal year beginning May 1, 2020. The adoption of this guidance is not anticipated to have a material impact on the consolidated financial statements.
In January 2017, the FASB issued guidance simplifying the test for goodwill impairment. The new guidance simplifies the test for goodwill impairment by removing Step 2 from the goodwill impairment test. Companies will now perform the goodwill impairment test by comparing the fair value of a reporting unit with its carrying amount, recognizing an impairment charge for the amount by which the carrying amount exceeds the reporting unit’s fair value not to exceed the total amount of goodwill allocated to that reporting unit. An entity still has the option to perform the qualitative assessment for a reporting unit to determine if the quantitative impairment test is necessary. The amendments of this standard are effective for goodwill impairment tests in fiscal years beginning after December 15, 2019, with early adoption permitted for goodwill impairment tests performed after January 1, 2017. We are evaluating the adoption timeline and the effects that the standard will have on the consolidated financial statements.
In August 2017, the FASB issued guidance amending and simplifying accounting for hedging activities. The new guidance will refine and expand strategies that qualify for hedge accounting and simplify the application of hedge accounting in certain situations. The amendments of this standard are effective for fiscal years beginning after December 15, 2018. We will adopt this guidance in its fiscal year beginning May 1, 2019. We are currently evaluating the impact of adopting this guidance.
In August 2018, the FASB issued guidance amending the disclosure requirements for fair value measurements. The amendment removes and modifies disclosures that are currently required and adds additional disclosures that are deemed relevant. The amendments of this standard are effective for fiscal years beginning after December 15, 2019. We will adopt this guidance in its fiscal year beginning May 1, 2020. We are currently evaluating the impact of adopting this guidance.
In August 2018, the FASB issued guidance amending accounting for internal-use software. The new guidance will align the requirements for capitalizing implementation costs incurred in a hosting arrangement that is a service contract with developing or obtaining internal-use software. The amendments of this standard are effective for fiscal years ending after December 15, 2019 with early adoption permitted. We will adopt this guidance in its fiscal year beginning May 1, 2020. We are currently evaluating the impact of adopting this guidance.
Item 7A. Quantitative and Qualitative Disclosures About Market Risk
As a result of our global operating activities, we are exposed to certain market risks, including foreign currency exchange fluctuations and fluctuations in interest rates. We manage our exposure to these risks in the normal course of our business as described below.
Foreign Currency Risk
Substantially all our foreign subsidiaries’ operations are measured in their local currencies. Assets and liabilities are translated into U.S. dollars at the rates of exchange in effect at the end of each reporting period and revenue and expenses are translated at average rates of exchange during the reporting period. Resulting translation adjustments are reported as a component of accumulated other comprehensive loss, net on our consolidated balance sheets.
Transactions denominated in a currency other than the reporting entity’s functional currency may give rise to foreign currency gains or losses that impact our results of operations. Historically, we have not realized significant foreign currency gains or losses on such transactions. During fiscal 2019 and 2018, we recorded foreign currency losses of $1.7 million and $3.3 million, respectively, in general and administrative expenses in the consolidated statements of income. During fiscal 2017, we recorded foreign currency gains of $0.3 million in general and administrative expenses in the consolidated statements of income.
Our exposure to foreign currency exchange rates is primarily driven by fluctuations involving the following currencies—U.S. Dollar, Canadian Dollar, Euro, Pound Sterling, Swiss Franc, Brazilian Real, Singapore Dollar and Mexican Peso. Based on balances exposed to fluctuation in exchange rates between these currencies as of April 30, 2019, a 10% increase or decrease equally in the value of these currencies could result in a foreign exchange gain or loss of $11.3 million. We have a program that primarily utilizes foreign currency forward contracts to offset the risks associated with the effects of certain foreign currency exposures. These foreign currency forward contracts are neither used for trading purposes nor are they designated as hedging instruments pursuant to ASC 815, Derivatives and Hedging.
49
Our exposure to interest rate risk is limited to our Revolver and borrowings against the CSV of COLI contracts. As of April 30, 2019, there was $226.9 million outstanding under the Revolver. At our option, loans issued under the Credit Agreement bear interest at either LIBOR or an alternate base rate, in each case plus the applicable interest rate margin. The interest rate applicable to loans outstanding under the Credit Agreement may fluctuate between LIBOR plus 1.25% per annum to LIBOR plus 2.00% per annum, in the case of LIBOR borrowings (or between the alternate base rate plus 0.25% per annum and the alternate base rate plus 1.00% per annum, in the alternative), based upon our total funded debt to Adjusted EBITDA ratio (as set forth in the Credit Agreement, the “consolidated net leverage ratio”) at such time. In addition, we are required to pay the lenders a quarterly commitment fee ranging from 0.20% to 0.35% per annum on the average daily unused amount of the Revolver, based upon our consolidated net leverage ratio at such time, and fees relating to the issuance of letters of credit. A 100-basis point increase in LIBOR rates would have increased our interest expense by approximately $2.3 million for fiscal 2019. During fiscal 2019, the average interest rate on the revolver loan was 3.50%.
To mitigate this interest rate risk, we entered into an interest rate swap contract with an initial notional amount of $129.8 million to hedge the variability to changes in cash flows attributable to interest rate risks caused by changes in interest rates related to our variable rate debt. We have designated the swap as a cash flow hedge. As of April 30, 2019 the notional amount was $106.6 million. The interest rate swap agreement matures on June 15, 2021 and locks the interest rates on a portion of our outstanding debt at 1.919%, exclusive of the credit spread on the debt.
We had $93.2 million and $66.7 million of borrowings against the CSV of COLI contracts as of April 30, 2019 and 2018, respectively, bearing interest primarily at variable rates. The risk of fluctuations in these variable rates is minimized by the fact that we receive a corresponding adjustment to our borrowed funds crediting rate which has the effect of increasing the CSV on our COLI contracts.
Item 8. Financial Statements and Supplementary Data
See Consolidated Financial Statements beginning on page F-1 of this Annual Report on Form 10-K.
Supplemental Financial Information regarding quarterly results is contained in Note 15—Quarterly Results, in the Notes to our Consolidated Financial Statements in this Annual Report on Form 10-K.
Item 9. Changes in and Disagreements With Accountants on Accounting and Financial Disclosure
Not applicable.
Item 9A. Controls and Procedures
As of the end of the period covered by this Annual Report on Form 10-K, management, our Chief Executive Officer and Chief Financial Officer evaluated the effectiveness of the design and operation of our disclosure controls and procedures and internal controls over financial reporting. Based on their evaluation of our disclosure controls and procedures conducted as of the end of the period covered by this Annual Report on Form 10-K, our Chief Executive Officer and Chief Financial Officer have concluded that our disclosure controls and procedures (as defined in Rules 13a-15(e) and 15d-15(e) under the Exchange Act of 1934 (the “Exchange Act”)) are effective.
|
b) |
Changes in Internal Control over Financial Reporting. |
There were no changes in our internal control over financial reporting during the fourth fiscal quarter that have materially affected or are reasonably likely to materially affect our internal control over financial reporting. See Management’s Report on Internal Control Over Financial Reporting and Report of Independent Registered Public Accounting Firm on Internal Control Over Financial Reporting on pages F-2 and F-3, respectively.
Not applicable.
50
Item 10. Directors, Executive Officers and Corporate Governance
The information required by this Item will be included under the captions “The Board of Directors” and if applicable
“Delinquent Section 16(a) Reports” and elsewhere in our 2019 Proxy Statement, and is incorporated herein by reference. The information under the heading “Information about our Executive Officers” in Part I of this Annual Report on Form 10-K is also incorporated by reference in this section.
We have adopted a “Code of Business Conduct and Ethics” that applies to all of our directors, officers and employees, including our principal executive officer (who is our Chief Executive Officer), principal financial officer, and principal accounting officer (who is our Chief Financial Officer) and senior financial officers, or persons performing similar functions. The Code of Business Conduct and Ethics is available on the Investor Relations portion of our website at http://ir.kornferry.com . We intend to disclose future amendments to certain provisions of the Code of Business Conduct and Ethics and waivers of the Code of Business Conduct and Ethics granted to executive officers and directors on our website within four business days following the date of the amendment or waiver.
Item 11. Executive Compensation
The information required by this Item will be included under the captions “Compensation Discussion and Analysis” and “Compensation of Executive Officers and Directors” and elsewhere in our 2019 Proxy Statement, and is incorporated herein by reference.
Item 12. Security Ownership of Certain Beneficial Owners and Management and Related Stockholder Matters
The information required by this Item will be included under the caption “Security Ownership of Certain Beneficial Owners and Management” and elsewhere in our 2019 Proxy Statement, and is incorporated herein by reference.
Item 13. Certain Relationships and Related Transactions, and Director Independence
The information required by this Item will be included under the caption “Certain Relationships and Related Transactions” and elsewhere in our 2019 Proxy Statement, and is incorporated herein by reference.
Item 14. Principal Accountant Fees and Services
The information required by this Item will be included under the captions “Fees Paid to Ernst & Young LLP,” and “Audit Committee Pre-Approval Policies and Procedures,” and elsewhere in our 2019 Proxy Statement, and is incorporated herein by reference.
51
Item 15. Exhibits and Financial Statement Schedules
Financial Statements.
|
a) |
The following documents are filed as part of this report: |
|
1. |
Index to Financial Statements: |
Page |
|
|
See Consolidated Financial Statements included as part of this Annual Report on Form 10-K and Schedule II — Valuation and Qualifying Accounts. Pursuant to Rule 7-05 of Regulation S-X, the other schedules have been omitted as the information to be set forth therein is included in the notes of the audited consolidated financial statements. |
F-1 |
Exhibits:
|
Exhibit Number |
|
Description |
|
2.1+ |
|
|
|
2.2+ |
|
|
|
2.3+ |
|
|
|
2.4+ |
|
|
|
3.1+ |
|
|
|
3.2+ |
|
|
|
4.1 |
|
|
|
4.2 |
|
|
|
10.1*+ |
|
|
|
10.2*+ |
|
|
|
10.3*+ |
|
|
|
10.4*+ |
|
|
|
10.5*+ |
|
|
|
10.6*+ |
|
|
|
10.7*+ |
|
|
|
10.8*+ |
|
|
|
10.9*+ |
|
52
|
Exhibit Number |
|
Description |
|
|
||
|
10.11*+ |
|
|
|
10.12*+ |
|
|
|
10.13*+ |
|
|
|
10.14*+ |
|
|
|
10.15*+ |
|
|
|
10.16*+ |
|
|
|
10.17* |
|
Korn Ferry Amended and Restated Employee Stock Purchase Plan. |
|
10.18*+ |
|
|
|
10.19*+ |
|
|
|
10.20*+ |
|
|
|
10.21*+ |
|
|
|
10.22*+ |
|
|
|
10.23* |
|
Amended and Restated Korn Ferry Executive Capital Accumulation Plan, as of January 1, 2019. |
|
10.24*+ |
|
|
|
10.25*+ |
|
|
|
10.26* |
|
|
|
10.27* |
|
Korn Ferry Long Term Performance Unit Plan Form of Unit Award Agreement. |
|
10.28* |
|
Third Amendment and Restated Korn Ferry 2008 Stock Incentive Plan. |
|
10.29*+ |
|
|
|
10.30*+ |
|
|
|
10.31* |
|
|
|
10.32* |
|
Form of Performance Restricted Stock Unit Award Agreement Under the 2008 Stock Incentive Plan. |
|
10.33* |
|
Form of Restricted Stock Unit Award Agreement to Employees Under the 2008 Stock Incentive Plan. |
|
10.34* |
|
Form of Restricted Stock Award Agreement to Employees Under the 2008 Stock Incentive Plan. |
|
10.35+ |
|
|
|
10.36+ |
|
|
|
21.1 |
|
|
|
23.1 |
|
Consent of Ernst & Young LLP, Independent Registered Public Accounting Firm. |
|
24.1 |
|
53
|
Exhibit Number |
|
Description |
|
|
Chief Executive Officer Certification pursuant to Rule 13a-14(a) under the Exchange Act. |
|
|
31.2 |
|
Chief Financial Officer Certification pursuant to Rule 13a-14(a) under the Exchange Act. |
|
32.1 |
|
|
|
101.INS |
|
XBRL Instance Document. |
|
101.SCH |
|
XBRL Taxonomy Extension Schema Document. |
|
101.CAL |
|
XBRL Taxonomy Extension Calculation Linkbase Document. |
|
101.DEF |
|
XBRL Taxonomy Extension Definition Linkbase Document. |
|
101.LAB |
|
XBRL Taxonomy Extension Label Linkbase Document. |
|
101.PRE |
|
XBRL Taxonomy Extension Presentation Linkbase Document. |
|
* |
Management contract, compensatory plan or arrangement. |
|
+ |
Incorporated herein by reference. |
None
54
Pursuant to the requirements of Section 13 or 15(d) of the Securities Exchange Act of 1934, as amended, the registrant has duly caused this report to be signed on its behalf by the undersigned, thereunto duly authorized.
Korn Ferry
By: /s/ Robert P. Rozek
Robert P. Rozek
Executive Vice President, Chief Financial Officer and Chief Corporate Officer
Date: June 28, 2019
KNOW ALL MEN BY THESE PRESENTS, that each of the undersigned officers and directors of the registrant hereby constitutes and appoints Jonathan M. Kuai and Gary D. Burnison, and each of them, as lawful attorney-in-fact and agent for each of the undersigned (with full power of substitution and resubstitution, for and in the name, place and stead of each of the undersigned officers and directors), to sign and file with the Securities and Exchange Commission under the Securities Exchange Act of 1934, as amended, any and all amendments, supplements and exhibits to this report and any and all other documents in connection therewith, hereby granting unto said attorneys-in-fact, and each of them, full power and authority to do and perform each and every act and thing necessary or desirable to be done in order to effectuate the same as fully and to all intents and purposes as each of the undersigned might or could do if personally present, hereby ratifying and confirming all that said attorneys-in-fact and agents, or any of them, or any of their substitutes, may do or cause to be done by virtue hereof.
Pursuant to the requirements of the Securities Exchange Act of 1934, as amended, this report has been signed below by the following persons on behalf of the registrant and in the capacities and on the dates indicated.
|
Signature |
|
Title |
|
Date |
|
|
|
|
|
|
|
/s/ CHRISTINA A. GOLD Christina A. Gold |
|
Chairman of the Board and Director |
|
June 28, 2019 |
|
/s/ GARY D. BURNISON Gary D. Burnison |
|
President & Chief Executive Officer (Principal Executive Officer) and Director |
|
June 28, 2019 |
|
/s/ ROBERT P. ROZEK Robert P. Rozek |
|
Executive Vice President, Chief Financial Officer and Chief Corporate Officer (Principal Financial Officer and Principal Accounting Officer) |
|
June 28, 2019 |
|
/s/ GEORGE T. SHAHEEN George T. Shaheen |
|
Director |
|
June 28, 2019 |
|
/s/ DOYLE N. BENEBY Doyle N. Beneby |
|
Director |
|
June 28, 2019 |
|
/s/ WILLIAM R. FLOYD William R. Floyd |
|
Director |
|
June 28, 2019 |
|
/s/ JERRY LEAMON Jerry Leamon |
|
Director |
|
June 28, 2019 |
|
/s/ ANGEL MARTINEZ Angel Martinez |
|
Director |
|
June 28, 2019 |
|
/s/ DEBRA J. PERRY Debra J. Perry |
|
Director |
|
June 28, 2019 |
55
KORN FERRY AND SUBSIDIARIES
INDEX TO CONSOLIDATED FINANCIAL STATEMENTS
APRIL 30, 2019
Page
F-1
MANAGEMENT’S REPORT ON INTERNAL CONTROL OVER FINANCIAL REPORTING
Management of Korn Ferry (the “Company”) is responsible for establishing and maintaining adequate internal control over financial reporting and for the assessment of the effectiveness of internal control over financial reporting. As defined by the Securities and Exchange Commission, internal control over financial reporting is a process designed by, or supervised by, the issuer’s principal executive and principal financial officers, and effected by the issuer’s board of directors, management and other personnel, to provide reasonable assurance regarding the reliability of financial reporting and the preparation of financial statements for external purposes in accordance with U.S. generally accepted accounting principles.
The Company’s internal control over financial reporting is supported by written policies and procedures, that (1) pertain to the maintenance of records that, in reasonable detail, accurately and fairly reflect the transactions and dispositions of the Company’s assets; (2) provide reasonable assurance that transactions are recorded as necessary to permit preparation of financial statements in accordance with generally accepted accounting principles, and that receipts and expenditures of the Company are being made only in accordance with authorizations of the Company’s management and directors; and (3) provide reasonable assurance regarding prevention or timely detection of unauthorized acquisition, use or disposition of the Company’s assets that could have a material effect on the financial statements.
Because of its inherent limitations, internal control over financial reporting may not prevent or detect misstatements. Projections of any evaluation of effectiveness to future periods are subject to the risk that controls may become inadequate because of changes in conditions, or that the degree of compliance with the policies or procedures may deteriorate.
In connection with the preparation of the Company’s annual financial statements, management of the Company has undertaken an assessment of the effectiveness of the Company’s internal control over financial reporting as of April 30, 2019 based on criteria established in Internal Control – Integrated Framework (2013) issued by the Committee of Sponsoring Organizations of the Treadway Commission. Management’s assessment included an evaluation of the design of the Company’s internal control over financial reporting and testing of the operational effectiveness of the Company’s internal control over financial reporting.
Based on this assessment, management did not identify any material weakness in the Company’s internal control over financial reporting, and management has concluded that the Company’s internal control over financial reporting was effective as of April 30, 2019.
Ernst & Young LLP, the independent registered public accounting firm that audited the Company’s financial statements for the year ended April 30, 2019 included in this Annual Report on Form 10-K, has issued an audit report on the effectiveness of the Company’s internal control over financial reporting as of April 30, 2019, a copy of which is included in this Annual Report on Form 10-K.
June 28, 2019
F-2
REPORT OF INDEPENDENT REGISTERED PUBLIC ACCOUNTING FIRM ON INTERNAL CONTROL OVER FINANCIAL REPORTING
To the Stockholders and Board of Directors of Korn Ferry:
Opinion on Internal Control over Financial Reporting
We have audited Korn Ferry and subsidiaries’ internal control over financial reporting as of April 30, 2019, based on criteria established in Internal Control— Integrated Framework issued by the Committee of Sponsoring Organizations of the Treadway Commission (2013 framework) (the COSO criteria). In our opinion, Korn Ferry and subsidiaries (the Company) maintained, in all material respects, effective internal control over financial reporting as of April 30, 2019, based on the COSO criteria.
We also have audited, in accordance with the standards of the Public Company Accounting Oversight Board (United States) (PCAOB), the consolidated balance sheets of the Company as of April 30, 2019 and 2018, the related consolidated statements of income, comprehensive income, stockholders' equity and cash flows for each of the three years in the period ended April 30, 2019 and the related notes and the financial statement schedule listed in the index at Item 15(a) and our report dated June 28, 2019 expressed an unqualified opinion thereon.
Basis for Opinion
The Company’s management is responsible for maintaining effective internal control over financial reporting and for its assessment of the effectiveness of internal control over financial reporting included in the accompanying Management’s Report on Internal Control over Financial Reporting. Our responsibility is to express an opinion on the Company’s internal control over financial reporting based on our audit. We are a public accounting firm registered with the PCAOB and are required to be independent with respect to the Company in accordance with the U.S. federal securities laws and the applicable rules and regulations of the Securities and Exchange Commission and the PCAOB.
We conducted our audit in accordance with the standards of the PCAOB. Those standards require that we plan and perform the audit to obtain reasonable assurance about whether effective internal control over financial reporting was maintained in all material respects.
Our audit included obtaining an understanding of internal control over financial reporting, assessing the risk that a material weakness exists, testing and evaluating the design and operating effectiveness of internal control based on the assessed risk, and performing such other procedures as we considered necessary in the circumstances. We believe that our audit provides a reasonable basis for our opinion.
Definition and Limitations of Internal Control Over Financial Reporting
A company’s internal control over financial reporting is a process designed to provide reasonable assurance regarding the reliability of financial reporting and the preparation of financial statements for external purposes in accordance with generally accepted accounting principles. A company’s internal control over financial reporting includes those policies and procedures that (1) pertain to the maintenance of records that, in reasonable detail, accurately and fairly reflect the transactions and dispositions of the assets of the company; (2) provide reasonable assurance that transactions are recorded as necessary to permit preparation of financial statements in accordance with generally accepted accounting principles, and that receipts and expenditures of the company are being made only in accordance with authorizations of management and directors of the company; and (3) provide reasonable assurance regarding prevention or timely detection of unauthorized acquisition, use, or disposition of the company’s assets that could have a material effect on the financial statements.
Because of its inherent limitations, internal control over financial reporting may not prevent or detect misstatements. Also, projections of any evaluation of effectiveness to future periods are subject to the risk that controls may become inadequate because of changes in conditions, or that the degree of compliance with the policies or procedures may deteriorate.
/s/ Ernst & Young LLP
Los Angeles, California
June 28, 2019
F-3
REPORT OF INDEPENDENT REGISTERED
PUBLIC ACCOUNTING FIRM
To the Stockholders and Board of Directors of Korn Ferry:
Opinion on the Financial Statements
We have audited the accompanying consolidated balance sheets of Korn Ferry and subsidiaries (the “Company”) as of April 30, 2019 and 2018, the related consolidated statements of income, comprehensive income, stockholders' equity and cash flows for each of the three years in the period ended April 30, 2019 and the related notes and the financial statement schedule listed in the index at Item 15(a) (collectively referred to as the “consolidated financial statements”). In our opinion, the consolidated financial statements present fairly, in all material respects, the financial position of the Company at April 30, 2019 and 2018, and the results of their operations and their cash flows for each of the three years in the period ended April 30, 2019, in conformity with U.S. generally accepted accounting principles.
We also have audited, in accordance with the standards of the Public Company Accounting Oversight Board (United States) (PCAOB), the Company's internal control over financial reporting as of April 30, 2019, based on criteria established in Internal Control-Integrated Framework issued by the Committee of Sponsoring Organizations of the Treadway Commission (2013 framework), and our report dated June 28, 2019 expressed an unqualified opinion thereon.
Basis for Opinion
These financial statements are the responsibility of the Company's management. Our responsibility is to express an opinion on the Company’s financial statements based on our audits. We are a public accounting firm registered with the PCAOB and are required to be independent with respect to the Company in accordance with the U.S. federal securities laws and the applicable rules and regulations of the Securities and Exchange Commission and the PCAOB.
We conducted our audits in accordance with the standards of the PCAOB. Those standards require that we plan and perform the audit to obtain reasonable assurance about whether the financial statements are free of material misstatement, whether due to error or fraud. Our audits included performing procedures to assess the risks of material misstatement of the financial statements, whether due to error or fraud, and performing procedures that respond to those risks. Such procedures included examining, on a test basis, evidence regarding the amounts and disclosures in the financial statements. Our audits also included evaluating the accounting principles used and significant estimates made by management, as well as evaluating the overall presentation of the financial statements. We believe that our audits provide a reasonable basis for our opinion.
/s/ Ernst & Young LLP
We have served as the Company’s auditor since 2002
Los Angeles, California
June 28, 2019
F-4
KORN FERRY AND SUBSIDIARIES
|
|
|
April 30, |
|
|||||
|
|
|
2019 |
|
|
2018 |
|
||
|
|
|
(in thousands, except per share data) |
|
|||||
|
ASSETS |
|
|
|
|
|
|
|
|
|
Cash and cash equivalents |
|
$ |
626,360 |
|
|
$ |
520,848 |
|
|
Marketable securities |
|
|
8,288 |
|
|
|
14,293 |
|
|
Receivables due from clients, net of allowance for doubtful accounts of $21,582 and $17,845 at April 30, 2019 and 2018, respectively |
|
|
404,857 |
|
|
|
384,996 |
|
|
Income taxes and other receivables |
|
|
26,767 |
|
|
|
29,089 |
|
|
Unearned compensation |
|
|
42,003 |
|
|
|
37,333 |
|
|
Prepaid expenses and other assets |
|
|
28,535 |
|
|
|
27,700 |
|
|
Total current assets |
|
|
1,136,810 |
|
|
|
1,014,259 |
|
|
|
|
|
|
|
|
|
|
|
|
Marketable securities, non-current |
|
|
132,463 |
|
|
|
122,792 |
|
|
Property and equipment, net |
|
|
131,505 |
|
|
|
119,901 |
|
|
Cash surrender value of company owned life insurance policies, net of loans |
|
|
126,000 |
|
|
|
120,087 |
|
|
Deferred income taxes |
|
|
43,220 |
|
|
|
25,520 |
|
|
Goodwill |
|
|
578,298 |
|
|
|
584,222 |
|
|
Intangible assets, net |
|
|
82,948 |
|
|
|
203,216 |
|
|
Unearned compensation, non-current |
|
|
80,924 |
|
|
|
78,295 |
|
|
Investments and other assets |
|
|
22,684 |
|
|
|
19,622 |
|
|
Total assets |
|
$ |
2,334,852 |
|
|
$ |
2,287,914 |
|
|
LIABILITIES AND STOCKHOLDERS’ EQUITY |
|
|
|
|
|
|
|
|
|
Accounts payable |
|
$ |
39,156 |
|
|
$ |
35,196 |
|
|
Income taxes payable |
|
|
21,145 |
|
|
|
23,034 |
|
|
Compensation and benefits payable |
|
|
328,610 |
|
|
|
304,980 |
|
|
Current portion of long-term debt |
|
|
— |
|
|
|
24,911 |
|
|
Other accrued liabilities |
|
|
162,047 |
|
|
|
170,339 |
|
|
Total current liabilities |
|
|
550,958 |
|
|
|
558,460 |
|
|
|
|
|
|
|
|
|
|
|
|
Deferred compensation and other retirement plans |
|
|
257,635 |
|
|
|
227,729 |
|
|
Long-term debt |
|
|
222,878 |
|
|
|
211,311 |
|
|
Deferred tax liabilities |
|
|
1,103 |
|
|
|
9,105 |
|
|
Other liabilities |
|
|
58,891 |
|
|
|
61,694 |
|
|
Total liabilities |
|
|
1,091,465 |
|
|
|
1,068,299 |
|
|
|
|
|
|
|
|
|
|
|
|
Commitments and contingencies |
|
|
|
|
|
|
|
|
|
|
|
|
|
|
|
|
|
|
|
Stockholders' equity |
|
|
|
|
|
|
|
|
|
Common stock: $0.01 par value, 150,000 shares authorized, 72,442 and 71,631 shares issued and 56,431 and 56,517 shares outstanding at April 30, 2019 and 2018, respectively |
|
|
656,463 |
|
|
|
683,942 |
|
|
Retained earnings |
|
|
660,845 |
|
|
|
572,800 |
|
|
Accumulated other comprehensive loss, net |
|
|
(76,652 |
) |
|
|
(40,135 |
) |
|
Total Korn Ferry stockholders' equity |
|
|
1,240,656 |
|
|
|
1,216,607 |
|
|
Noncontrolling interest |
|
|
2,731 |
|
|
|
3,008 |
|
|
Total stockholders' equity |
|
|
1,243,387 |
|
|
|
1,219,615 |
|
|
Total liabilities and stockholders' equity |
|
$ |
2,334,852 |
|
|
$ |
2,287,914 |
|
The accompanying notes are an integral part of these consolidated financial statements.
F-5
CONSOLIDATED STATEMENTS OF INCOME
|
|
|
Year Ended April 30, |
|
|||||||||
|
|
|
2019 |
|
|
2018 |
|
|
2017 |
|
|||
|
|
|
(in thousands, except per share data) |
|
|||||||||
|
Fee revenue |
|
$ |
1,926,033 |
|
|
$ |
1,767,217 |
|
|
$ |
1,565,521 |
|
|
Reimbursed out-of-pocket engagement expenses |
|
|
47,829 |
|
|
|
52,302 |
|
|
|
56,148 |
|
|
Total revenue |
|
|
1,973,862 |
|
|
|
1,819,519 |
|
|
|
1,621,669 |
|
|
|
|
|
|
|
|
|
|
|
|
|
|
|
|
Compensation and benefits |
|
|
1,311,240 |
|
|
|
1,199,057 |
|
|
|
1,065,659 |
|
|
General and administrative expenses |
|
|
351,991 |
|
|
|
237,390 |
|
|
|
226,232 |
|
|
Reimbursed expenses |
|
|
47,829 |
|
|
|
52,302 |
|
|
|
56,148 |
|
|
Cost of services |
|
|
75,487 |
|
|
|
73,658 |
|
|
|
71,482 |
|
|
Depreciation and amortization |
|
|
46,489 |
|
|
|
48,588 |
|
|
|
47,260 |
|
|
Restructuring charges, net |
|
|
— |
|
|
|
78 |
|
|
|
34,600 |
|
|
Total operating expenses |
|
|
1,833,036 |
|
|
|
1,611,073 |
|
|
|
1,501,381 |
|
|
|
|
|
|
|
|
|
|
|
|
|
|
|
|
Operating income |
|
|
140,826 |
|
|
|
208,446 |
|
|
|
120,288 |
|
|
Other income, net |
|
|
10,094 |
|
|
|
11,119 |
|
|
|
10,328 |
|
|
Interest expense, net |
|
|
(16,891 |
) |
|
|
(13,832 |
) |
|
|
(14,607 |
) |
|
Income before provision for income taxes and equity in earnings of unconsolidated subsidiaries |
|
|
134,029 |
|
|
|
205,733 |
|
|
|
116,009 |
|
|
Equity in earnings of unconsolidated subsidiaries, net |
|
|
311 |
|
|
|
297 |
|
|
|
333 |
|
|
Income tax provision |
|
|
29,544 |
|
|
|
70,133 |
|
|
|
29,104 |
|
|
Net income |
|
|
104,796 |
|
|
|
135,897 |
|
|
|
87,238 |
|
|
Net income attributable to noncontrolling interest |
|
|
(2,145 |
) |
|
|
(2,118 |
) |
|
|
(3,057 |
) |
|
Net income attributable to Korn Ferry |
|
$ |
102,651 |
|
|
$ |
133,779 |
|
|
$ |
84,181 |
|
|
|
|
|
|
|
|
|
|
|
|
|
|
|
|
Earnings per common share attributable to Korn Ferry: |
|
|
|
|
|
|
|
|
|
|
|
|
|
Basic |
|
$ |
1.84 |
|
|
$ |
2.39 |
|
|
$ |
1.48 |
|
|
Diluted |
|
$ |
1.81 |
|
|
$ |
2.35 |
|
|
$ |
1.47 |
|
|
|
|
|
|
|
|
|
|
|
|
|
|
|
|
Weighted-average common shares outstanding: |
|
|
|
|
|
|
|
|
|
|
|
|
|
Basic |
|
|
55,311 |
|
|
|
55,426 |
|
|
|
56,205 |
|
|
Diluted |
|
|
56,096 |
|
|
|
56,254 |
|
|
|
56,900 |
|
|
|
|
|
|
|
|
|
|
|
|
|
|
|
|
Cash dividends declared per share: |
|
$ |
0.40 |
|
|
$ |
0.40 |
|
|
$ |
0.40 |
|
The accompanying notes are an integral part of these consolidated financial statements.
F-6
CONSOLIDATED STATEMENTS OF COMPREHENSIVE INCOME
|
|
|
Year Ended April 30, |
|
|||||||||
|
|
|
2019 |
|
|
2018 |
|
|
2017 |
|
|||
|
|
|
(in thousands) |
|
|||||||||
|
|
|
|
|
|
|
|
|
|
|
|
|
|
|
Net income |
|
$ |
104,796 |
|
|
$ |
135,897 |
|
|
$ |
87,238 |
|
|
|
|
|
|
|
|
|
|
|
|
|
|
|
|
Other comprehensive (loss) income: |
|
|
|
|
|
|
|
|
|
|
|
|
|
Foreign currency translation adjustments |
|
|
(28,038 |
) |
|
|
22,900 |
|
|
|
(19,266 |
) |
|
Deferred compensation and pension plan adjustments, net of tax |
|
|
(5,369 |
) |
|
|
6,054 |
|
|
|
6,445 |
|
|
Net unrealized (loss) gain on interest rate swap, net of tax |
|
|
(1,080 |
) |
|
|
1,915 |
|
|
|
(578 |
) |
|
Comprehensive income |
|
|
70,309 |
|
|
|
166,766 |
|
|
|
73,839 |
|
|
Less: comprehensive income attributable to noncontrolling interest |
|
|
(1,978 |
) |
|
|
(2,058 |
) |
|
|
(2,811 |
) |
|
Comprehensive income attributable to Korn Ferry |
|
$ |
68,331 |
|
|
$ |
164,708 |
|
|
$ |
71,028 |
|
The accompanying notes are an integral part of these consolidated financial statements.
F-7
CONSOLIDATED STATEMENTS OF STOCKHOLDERS’ EQUITY
|
|
|
|
|
|
|
|
|
|
|
|
|
|
Accumulated Other |
|
|
Total |
|
|
|
|
|
|
|
|
|
||
|
|
|
|
|
|
|
|
|
|
|
|
|
|
Comprehensive |
|
|
Korn Ferry |
|
|
|
|
|
|
Total |
|
|||
|
|
Common Stock |
|
|
Retained |
|
|
(Loss) Income, |
|
|
Stockholders' |
|
|
Noncontrolling |
|
|
Stockholder's |
|
||||||||||
|
|
Shares |
|
|
Amount |
|
|
Earnings |
|
|
Net |
|
|
Equity |
|
|
Interest |
|
|
Equity |
|
|||||||
|
|
(in thousands) |
|
|||||||||||||||||||||||||
|
Balance at May 1, 2016 |
|
57,272 |
|
|
$ |
702,098 |
|
|
$ |
401,113 |
|
|
$ |
(57,911 |
) |
|
$ |
1,045,300 |
|
|
$ |
2,001 |
|
|
$ |
1,047,301 |
|
|
Net income |
|
— |
|
|
|
— |
|
|
|
84,181 |
|
|
|
— |
|
|
|
84,181 |
|
|
|
3,057 |
|
|
|
87,238 |
|
|
Other comprehensive loss |
|
— |
|
|
|
— |
|
|
|
— |
|
|
|
(13,153 |
) |
|
|
(13,153 |
) |
|
|
(246 |
) |
|
|
(13,399 |
) |
|
Dividends paid to shareholders |
|
— |
|
|
|
— |
|
|
|
(23,318 |
) |
|
|
— |
|
|
|
(23,318 |
) |
|
|
— |
|
|
|
(23,318 |
) |
|
Dividends paid to noncontrolling interest |
|
— |
|
|
|
— |
|
|
|
— |
|
|
|
— |
|
|
|
— |
|
|
|
(1,203 |
) |
|
|
(1,203 |
) |
|
Purchase of stock |
|
(1,346 |
) |
|
|
(33,579 |
) |
|
|
— |
|
|
|
— |
|
|
|
(33,579 |
) |
|
|
— |
|
|
|
(33,579 |
) |
|
Issuance of stock |
|
1,012 |
|
|
|
5,886 |
|
|
|
— |
|
|
|
— |
|
|
|
5,886 |
|
|
|
— |
|
|
|
5,886 |
|
|
Stock-based compensation |
|
— |
|
|
|
18,045 |
|
|
|
— |
|
|
|
— |
|
|
|
18,045 |
|
|
|
— |
|
|
|
18,045 |
|
|
Tax benefit from exercise of stock options and vesting of restricted stock |
|
— |
|
|
|
77 |
|
|
|
— |
|
|
|
— |
|
|
|
77 |
|
|
|
— |
|
|
|
77 |
|
|
Balance at April 30, 2017 |
|
56,938 |
|
|
|
692,527 |
|
|
|
461,976 |
|
|
|
(71,064 |
) |
|
|
1,083,439 |
|
|
|
3,609 |
|
|
|
1,087,048 |
|
|
Net income |
|
— |
|
|
|
— |
|
|
|
133,779 |
|
|
|
— |
|
|
|
133,779 |
|
|
|
2,118 |
|
|
|
135,897 |
|
|
Other comprehensive income (loss) |
|
— |
|
|
|
— |
|
|
|
— |
|
|
|
30,929 |
|
|
|
30,929 |
|
|
|
(60 |
) |
|
|
30,869 |
|
|
Dividends paid to shareholders |
|
— |
|
|
|
— |
|
|
|
(22,955 |
) |
|
|
— |
|
|
|
(22,955 |
) |
|
|
— |
|
|
|
(22,955 |
) |
|
Dividends paid to noncontrolling interest |
|
— |
|
|
|
— |
|
|
|
— |
|
|
|
— |
|
|
|
— |
|
|
|
(2,659 |
) |
|
|
(2,659 |
) |
|
Purchase of stock |
|
(1,092 |
) |
|
|
(36,865 |
) |
|
|
— |
|
|
|
— |
|
|
|
(36,865 |
) |
|
|
— |
|
|
|
(36,865 |
) |
|
Issuance of stock |
|
671 |
|
|
|
7,998 |
|
|
|
— |
|
|
|
— |
|
|
|
7,998 |
|
|
|
— |
|
|
|
7,998 |
|
|
Stock-based compensation |
|
— |
|
|
|
20,282 |
|
|
|
— |
|
|
|
— |
|
|
|
20,282 |
|
|
|
— |
|
|
|
20,282 |
|
|
Balance at April 30, 2018 |
|
56,517 |
|
|
|
683,942 |
|
|
|
572,800 |
|
|
|
(40,135 |
) |
|
|
1,216,607 |
|
|
|
3,008 |
|
|
|
1,219,615 |
|
|
Net income |
|
— |
|
|
|
— |
|
|
|
102,651 |
|
|
|
— |
|
|
|
102,651 |
|
|
|
2,145 |
|
|
|
104,796 |
|
|
Other comprehensive loss |
|
— |
|
|
|
— |
|
|
|
— |
|
|
|
(34,320 |
) |
|
|
(34,320 |
) |
|
|
(167 |
) |
|
|
(34,487 |
) |
|
Effect of adoption of accounting standards |
|
— |
|
|
|
— |
|
|
|
8,853 |
|
|
|
(2,197 |
) |
|
|
6,656 |
|
|
|
— |
|
|
|
6,656 |
|
|
Dividends paid to shareholders |
|
— |
|
|
|
— |
|
|
|
(23,459 |
) |
|
|
— |
|
|
|
(23,459 |
) |
|
|
— |
|
|
|
(23,459 |
) |
|
Dividends paid to noncontrolling interest |
|
— |
|
|
|
— |
|
|
|
— |
|
|
|
— |
|
|
|
— |
|
|
|
(2,255 |
) |
|
|
(2,255 |
) |
|
Purchase of stock |
|
(1,166 |
) |
|
|
(58,070 |
) |
|
|
— |
|
|
|
— |
|
|
|
(58,070 |
) |
|
|
— |
|
|
|
(58,070 |
) |
|
Issuance of stock |
|
1,080 |
|
|
|
8,528 |
|
|
|
— |
|
|
|
— |
|
|
|
8,528 |
|
|
|
— |
|
|
|
8,528 |
|
|
Stock-based compensation |
|
— |
|
|
|
22,063 |
|
|
|
— |
|
|
|
— |
|
|
|
22,063 |
|
|
|
— |
|
|
|
22,063 |
|
|
Balance at April 30, 2019 |
|
56,431 |
|
|
$ |
656,463 |
|
|
$ |
660,845 |
|
|
$ |
(76,652 |
) |
|
$ |
1,240,656 |
|
|
$ |
2,731 |
|
|
$ |
1,243,387 |
|
The accompanying notes are an integral part of these consolidated financial statements.
F-8
CONSOLIDATED STATEMENTS OF CASH FLOWS
|
|
|
Year Ended April 30, |
|
|||||||||
|
|
|
2019 |
|
|
2018 |
|
|
2017 |
|
|||
|
|
|
(in thousands) |
|
|||||||||
|
Cash flows from operating activities: |
|
|
|
|
|
|
|
|
|
|
|
|
|
Net income |
|
$ |
104,796 |
|
|
$ |
135,897 |
|
|
$ |
87,238 |
|
|
Adjustments to reconcile net income to net cash provided by operating activities: |
|
|
|
|
|
|
|
|
|
|
|
|
|
Depreciation and amortization |
|
|
46,489 |
|
|
|
48,588 |
|
|
|
47,260 |
|
|
Stock-based compensation expense |
|
|
23,385 |
|
|
|
21,469 |
|
|
|
18,958 |
|
|
Impairment of tradenames |
|
|
106,555 |
|
|
|
— |
|
|
|
— |
|
|
Provision for doubtful accounts |
|
|
14,260 |
|
|
|
13,675 |
|
|
|
12,987 |
|
|
Gain on cash surrender value of life insurance policies |
|
|
(6,160 |
) |
|
|
(7,776 |
) |
|
|
(4,918 |
) |
|
Gain on marketable securities |
|
|
(8,134 |
) |
|
|
(10,278 |
) |
|
|
(10,842 |
) |
|
Deferred income taxes |
|
|
(27,796 |
) |
|
|
(6,564 |
) |
|
|
6,589 |
|
|
Change in other assets and liabilities: |
|
|
|
|
|
|
|
|
|
|
|
|
|
Deferred compensation |
|
|
18,478 |
|
|
|
27,660 |
|
|
|
6,868 |
|
|
Receivables due from clients |
|
|
(30,625 |
) |
|
|
(53,357 |
) |
|
|
(42,326 |
) |
|
Income taxes and other receivables |
|
|
1,409 |
|
|
|
2,093 |
|
|
|
(10,177 |
) |
|
Prepaid expenses and other assets |
|
|
(148 |
) |
|
|
(2,118 |
) |
|
|
(1,796 |
) |
|
Unearned compensation |
|
|
(7,299 |
) |
|
|
(42,742 |
) |
|
|
(17,465 |
) |
|
Investment in unconsolidated subsidiaries |
|
|
(311 |
) |
|
|
(297 |
) |
|
|
(333 |
) |
|
Income taxes payable |
|
|
213 |
|
|
|
32,439 |
|
|
|
205 |
|
|
Accounts payable and accrued liabilities |
|
|
28,398 |
|
|
|
66,081 |
|
|
|
5,420 |
|
|
Other |
|
|
(4,705 |
) |
|
|
(5,645 |
) |
|
|
8,473 |
|
|
Net cash provided by operating activities |
|
|
258,805 |
|
|
|
219,125 |
|
|
|
106,141 |
|
|
Cash flows from investing activities: |
|
|
|
|
|
|
|
|
|
|
|
|
|
Purchase of property and equipment |
|
|
(46,682 |
) |
|
|
(42,000 |
) |
|
|
(50,088 |
) |
|
Purchase of marketable securities |
|
|
(9,476 |
) |
|
|
(9,462 |
) |
|
|
(10,536 |
) |
|
Proceeds from sales/maturities of marketable securities |
|
|
13,781 |
|
|
|
2,642 |
|
|
|
42,815 |
|
|
Cash paid for acquisitions, net of cash acquired |
|
|
— |
|
|
|
— |
|
|
|
(2,880 |
) |
|
Premium on company-owned life insurance policies |
|
|
(34,862 |
) |
|
|
(1,614 |
) |
|
|
(1,597 |
) |
|
Proceeds from life insurance policies |
|
|
7,632 |
|
|
|
5,355 |
|
|
|
1,117 |
|
|
Dividends received from unconsolidated subsidiaries |
|
|
140 |
|
|
|
240 |
|
|
|
564 |
|
|
Net cash used in investing activities |
|
|
(69,467 |
) |
|
|
(44,839 |
) |
|
|
(20,605 |
) |
|
Cash flows from financing activities: |
|
|
|
|
|
|
|
|
|
|
|
|
|
Proceeds from long term debt |
|
|
226,875 |
|
|
|
— |
|
|
|
275,000 |
|
|
Principal payments on term loan |
|
|
(238,906 |
) |
|
|
(20,625 |
) |
|
|
(155,469 |
) |
|
Payment of debt issuance costs |
|
|
(2,181 |
) |
|
|
— |
|
|
|
— |
|
|
Repurchases of common stock |
|
|
(37,372 |
) |
|
|
(33,071 |
) |
|
|
(28,821 |
) |
|
Payments of tax withholdings on restricted stock |
|
|
(20,698 |
) |
|
|
(3,794 |
) |
|
|
(4,758 |
) |
|
Payment of contingent consideration from acquisitions |
|
|
(455 |
) |
|
|
(485 |
) |
|
|
(1,070 |
) |
|
Proceeds from issuance of common stock upon exercise of employee stock options and in connection with an employee stock purchase plan |
|
|
7,272 |
|
|
|
6,885 |
|
|
|
5,121 |
|
|
Dividends paid to shareholders |
|
|
(23,459 |
) |
|
|
(22,955 |
) |
|
|
(23,318 |
) |
|
Dividends - noncontrolling interest |
|
|
(2,255 |
) |
|
|
(2,659 |
) |
|
|
(1,203 |
) |
|
Borrowings under life insurance policies |
|
|
31,870 |
|
|
|
— |
|
|
|
— |
|
|
Payments on life insurance policy loans |
|
|
(5,316 |
) |
|
|
(554 |
) |
|
|
(1,117 |
) |
|
Net cash (used in) provided by financing activities |
|
|
(64,625 |
) |
|
|
(77,258 |
) |
|
|
64,365 |
|
|
Effect of exchange rate changes on cash and cash equivalents |
|
|
(19,201 |
) |
|
|
12,938 |
|
|
|
(12,271 |
) |
|
Net increase in cash and cash equivalents |
|
|
105,512 |
|
|
|
109,966 |
|
|
|
137,630 |
|
|
Cash and cash equivalents at beginning of year |
|
|
520,848 |
|
|
|
410,882 |
|
|
|
273,252 |
|
|
Cash and cash equivalents at end of the period |
|
$ |
626,360 |
|
|
$ |
520,848 |
|
|
$ |
410,882 |
|
|
Supplemental cash flow information: |
|
|
|
|
|
|
|
|
|
|
|
|
|
Cash used to pay interest |
|
$ |
14,188 |
|
|
$ |
11,946 |
|
|
$ |
10,882 |
|
|
Cash used to pay income taxes, net of refunds |
|
$ |
58,408 |
|
|
$ |
37,486 |
|
|
$ |
32,458 |
|
The accompanying notes are an integral part of these consolidated financial statements.
F-9
NOTES TO CONSOLIDATED FINANCIAL STATEMENTS
April 30, 2019
1. Organization and Summary of Significant Accounting Policies
Nature of Business
On June 12, 2018, the Board of Directors of Korn Ferry, a Delaware corporation (the “Company”) and its subsidiaries approved a plan (the “Plan”) to go to market under a single, master brand architecture and to simplify the Company’s organizational structure by eliminating and/or consolidating certain legal entities and implementing a rebranding of the Company to offer the Company’s current products and services using the “Korn Ferry” name, branding and trademarks. In connection with the Plan, (i) the Company has sunset all sub-brands, including Futurestep, Hay Group and Lominger, among others, and (ii) effective as of January 1, 2019, the Company has been renamed “Korn Ferry.” The Company is harmonizing under one brand to help accelerate the firm’s positioning as the preeminent organizational consultancy and bring more client awareness to its broad range of talent management solutions. While the rebranding did not impact the Company’s segment financial reporting, the Company renamed its Hay Group segment as Korn Ferry Advisory (“Advisory”) and its Futurestep segment as Korn Ferry RPO and Professional Search (“RPO & Professional Search”). The Company’s Executive Search segment name remains unchanged.
The Company currently operates in three global businesses: Executive Search, Advisory and RPO & Professional Search. The Executive Search segment focuses on recruiting board level, chief executive and other senior executive and general management positions, in addition to research-based interviewing and onboarding solutions, for clients predominantly in the consumer goods, financial services, industrial, life sciences/healthcare and technology industries. Advisory assists clients to synchronize strategy and talent by addressing four fundamental needs: Organizational Strategy, Assessment and Succession, Leadership Development, and Rewards and Benefits, all underpinned by a comprehensive array of world-leading intellectual property, products and tools. RPO & Professional Search is a global industry leader in high-impact talent acquisition solutions. Its portfolio of services includes global and regional Recruitment Process Outsourcing (“RPO”), project recruitment, individual professional search and consulting.
Basis of Consolidation and Presentation
The consolidated financial statements include the accounts of the Company and its wholly and majority owned/controlled domestic and international subsidiaries. All intercompany balances and transactions have been eliminated in consolidation. The preparation of the consolidated financial statements conform with United States (“U.S.”) generally accepted accounting principles (“GAAP”) and prevailing practice within the industry. The consolidated financial statements include all adjustments, consisting of normal recurring accruals and any other adjustments that management considers necessary for a fair presentation of the results for these periods.
Investments in affiliated companies, which are 50% or less owned and where the Company exercises significant influence over operations, are accounted for using the equity method. Dividends received from our unconsolidated subsidiaries were approximately $0.1 million, $0.2 million and $0.6 million during fiscal 2019, 2018 and 2017, respectively.
The Company has control of a Mexico subsidiary and consolidates the operations of this subsidiary. Noncontrolling interest, which represents the Mexico Partners 51% interest in the Mexico subsidiary, is reflected on the Company’s consolidated financial statements.
The Company considers events or transactions that occur after the balance sheet date but before the consolidated financial statements are issued to provide additional evidence relative to certain estimates or to identify matters that require additional disclosures.
Use of Estimates and Uncertainties
The preparation of the consolidated financial statements in conformity with GAAP requires management to make estimates and assumptions that affect the reported amounts of assets and liabilities and disclosure of contingent assets and liabilities at the date of the consolidated financial statements and the reported amounts of revenue and expenses during the reporting period. Actual results could differ from these estimates, and changes in estimates are reported in current operations as new information is learned or upon the amounts becoming fixed or determinable. The most significant areas that require management’s judgment are revenue recognition, deferred compensation, annual performance-related bonuses, evaluation of the carrying value of receivables, goodwill and other intangible assets, share-based payments and the recoverability of deferred income taxes.
F-10
KORN FERRY AND SUBSIDIARIES
NOTES TO CONSOLIDATED FINANCIAL STATEMENTS
April 30, 2019 (continued)
Substantially all fee revenue is derived from fees for professional services related to executive and professional recruitment performed on a retained basis, recruitment process outsourcing, talent and organizational advisory services and the sale of products, either stand-alone or as part of a solution.
Revenue is recognized when control of the goods and services are transferred to the customer in an amount that reflects the consideration the Company expects to be entitled to in exchange for those goods and services. Revenue contracts with customers are evaluated based on the five-step model outlined in Accounting Standard Codification 606 (“ASC 606”): 1) identify the contract with a customer; 2) identify the performance obligation(s) in the contract; 3) determine the transaction price; 4) allocate the transaction price to the separate performance obligation(s); and 5) recognize revenue when (or as) each performance obligation is satisfied.
Fee revenue from executive and professional search activities is generally one-third of the estimated first-year compensation of the placed candidate, plus a percentage of the fee to cover indirect engagement-related expenses. In addition to the search retainer, an uptick fee is billed when the actual compensation awarded by the client for a placement is higher than the estimated compensation. In the aggregate, upticks have been a relatively consistent percentage of the original estimated fee; therefore, the Company estimates upticks using the expected value method based on historical data on a portfolio basis. In a standard search engagement, there is one performance obligation, which is the promise to undertake a search. The Company generally recognizes such revenue over the course of a search and when it is legally entitled to payment as outlined in the billing terms of the contract. Any revenues associated with services that are provided on a contingent basis are recognized once the contingency is resolved, as this is when control is transferred to the customer. These assumptions determine the timing of revenue recognition for the reported period.
RPO fee revenue is generated through two distinct phases: 1) the implementation phase and 2) the post-implementation recruitment phase. The fees associated with the implementation phase are recognized over the period that the related implementation services are provided. The post-implementation recruitment phase represents end-to-end recruiting services to clients for which there are both fixed and variable fees, which are recognized over the period that the related recruiting services are performed.
Consulting fee revenue, primarily generated from Advisory, is recognized as services are rendered, measured by total hours incurred to the total estimated hours at completion. It is possible that updated estimates for consulting engagements may vary from initial estimates, with such updates being recognized in the period of determination. Depending on the timing of billings and services rendered, the Company accrues or defers revenue as appropriate.
Product revenue is generated from a range of online tools designed to support human resource processes for pay, talent and engagement, and assessments, as well as licenses to proprietary intellectual property (“IP”) and tangible/digital products. IP subscriptions grant access to proprietary compensation and job evaluation databases. IP subscriptions are considered symbolic IP due to the dynamic nature of the content and, as a result, revenue is recognized over the term of the contract. Functional IP licenses grant customers the right to use IP content via delivery of a flat file. Because the IP content license has significant stand-alone functionality, revenue is recognized upon delivery and when an enforceable right to payment exists. Online assessments are delivered in the form of online questionnaires. A bundle of assessments represents one performance obligation, and revenue is recognized as assessment services are delivered and the Company has a legally enforceable right to payment. Tangible/digital products sold by the Company mainly consist of books and digital files covering a variety of topics, including performance management, team effectiveness, and coaching and development. The Company recognizes revenue for its products when sold or shipped, as is the case for books.
Reimbursements
The Company incurs certain out-of-pocket expenses that are reimbursed by its clients, which are accounted for as revenue in the consolidated statements of income.
Allowance for Doubtful Accounts
An allowance is established for doubtful accounts by taking a charge to general and administrative expenses. The amount of the allowance is based on historical loss experience and assessment of the collectability of specific accounts, as well as expectations of future collections based upon trends and the type of work for which services are rendered. After the Company exhausts all collection efforts, the amount of the allowance is reduced for balances identified as uncollectible.
F-11
KORN FERRY AND SUBSIDIARIES
NOTES TO CONSOLIDATED FINANCIAL STATEMENTS
April 30, 2019 (continued)
The Company considers all highly liquid investments with original maturities of three months or less from the date of purchase to be cash equivalents. As of April 30, 2019 and 2018, the Company’s investments in cash equivalents consisted of money market funds for which market prices are readily available.
Marketable Securities
The Company currently has investments in mutual funds (for which market prices are readily available) that are held in trust to satisfy obligations under the Company’s deferred compensation plans. Such investments are based upon the employees’ investment elections in their deemed accounts in the Executive Capital Accumulation Plan and similar plans in Asia Pacific and Canada (“ECAP”) from a pre-determined set of securities and the Company invests in marketable securities to mirror these elections. These investments are recorded at fair value, with the change in value in the period being reflected in the consolidated statements of income and are classified as marketable securities in the accompanying consolidated balance sheets. The investments that the Company may sell within the next twelve months are carried as current assets. Realized gains (losses) on marketable securities are determined by specific identification. Interest is recognized on an accrual basis; dividends are recorded as earned on the ex-dividend date. Interest, dividend income and the changes in fair value in marketable securities are recorded in the accompanying consolidated statements of income in other income, net.
Fair Value of Financial Instruments
Fair value is the price the Company would receive to sell an asset or transfer a liability (exit price) in an orderly transaction between market participants. For those assets and liabilities recorded or disclosed at fair value, the Company determines the fair value based upon the quoted market price, if available. If a quoted market price is not available for identical assets, the fair value is based upon the quoted market price of similar assets. The fair values are assigned a level within the fair value hierarchy as defined below:
|
|
▪ |
Level 1: Observable inputs such as quoted prices (unadjusted) in active markets that are accessible at the measurement date for identical, unrestricted assets or liabilities. |
|
|
▪ |
Level 2: Inputs other than quoted prices that are observable for the asset or liability, either directly or indirectly. These include quoted prices for similar assets or liabilities in active markets and quoted prices for identical or similar assets or liabilities in markets that are not active. |
|
|
▪ |
Level 3: Unobservable inputs that reflect the reporting entity’s own assumptions. |
As of April 30, 2019 and 2018, the Company held certain assets that are required to be measured at fair value on a recurring basis. These included cash, cash equivalents, accounts receivable, marketable securities, foreign currency forward contracts and an interest rate swap. The carrying amount of cash, cash equivalents and accounts receivable approximates fair value due to the short-term maturity of these instruments. The fair values of marketable securities are obtained from quoted market prices, and the fair values of foreign currency forward contracts and the interest rate swap are obtained from a third party, which are based on quoted prices or market prices for similar assets and financial instruments.
Derivative Financial Instruments
The Company has entered into an interest rate swap agreement to effectively convert its variable debt to a fixed-rate basis. The principal objective of these contracts is to eliminate or reduce the variability of the cash flows in interest payments associated with the Company’s long-term debt, thus reducing the impact of interest rate changes on future interest payment cash flows. The Company has determined that the interest rate swap qualifies as a cash flow hedge in accordance with Accounting Standards Codification 815, Derivatives and Hedging (“ASC 815”). Changes in the fair value of an interest rate swap agreement designated as a cash flow hedge are recorded as a component of accumulated other comprehensive (loss) income within stockholders’ equity and are amortized to interest expense over the term of the related debt.
Foreign Currency Forward Contracts Not Designated as Hedges
The Company has established a program that primarily utilizes foreign currency forward contracts to offset the risks associated with the effects of certain foreign currency exposures primarily originating from intercompany balances due to cross border work performed in the ordinary course of business. These foreign currency forward contracts are
F-12
KORN FERRY AND SUBSIDIARIES
NOTES TO CONSOLIDATED FINANCIAL STATEMENTS
April 30, 2019 (continued)
neither used for trading purposes nor are they designated as hedging instruments pursuant to ASC 815. Accordingly, the fair value of these contracts is recorded as of the end of the reporting period in the accompanying consolidated balance sheets, while the change in fair value is recorded to the accompanying consolidated statements of income.
Business Acquisitions
Business acquisitions are accounted for under the acquisition method. The acquisition method requires the reporting entity to identify the acquirer, determine the acquisition date, recognize and measure the identifiable assets acquired, the liabilities assumed and any noncontrolling interest in the acquired entity, and recognize and measure goodwill or a gain from the purchase. The acquiree’s results are included in the Company’s consolidated financial statements from the date of acquisition. Assets acquired and liabilities assumed are recorded at their fair values and the excess of the purchase price over the amounts assigned is recorded as goodwill, or if the fair value of the assets acquired exceeds the purchase price consideration, a bargain purchase gain is recorded. Adjustments to fair value assessments are generally recorded to goodwill over the measurement period (not longer than twelve months). The acquisition method also requires that acquisition-related transaction and post-acquisition restructuring costs be charged to expense as committed and requires the Company to recognize and measure certain assets and liabilities including those arising from contingencies and contingent consideration in a business combination.
Property and Equipment, Net
Property and equipment is carried at cost less accumulated depreciation. Leasehold improvements are amortized on a straight-line basis over the estimated useful life of the asset, or the lease term, whichever is shorter. Software development costs incurred for internal use projects are capitalized and, once placed in service, amortized using the straight-line method over the estimated useful life, generally three to seven years. All other property and equipment is depreciated or amortized on a straight-line basis over the estimated useful lives of three to ten years.
The Company reviews long-lived assets for impairment whenever events or changes in circumstances indicate that the carrying value of an asset may not be recoverable. In fiscal 2019, 2018 and 2017, there were no such impairment charges recorded.
Goodwill and Intangible Assets
Goodwill represents the excess of the purchase price over the fair value of assets acquired. The goodwill impairment test compares the fair value of a reporting unit with its carrying amount, including goodwill. If the carrying amount of a reporting unit exceeds its fair value, goodwill of the reporting unit would be considered impaired. To measure the amount of the impairment loss, the implied fair value of a reporting unit’s goodwill is compared to the carrying amount of that goodwill. The implied fair value of goodwill is determined in the same manner as the amount of goodwill recognized in a business combination. If the carrying amount of a reporting unit’s goodwill exceeds the implied fair value of that goodwill, an impairment loss is recognized in an amount equal to that excess. For each of these tests, the fair value of each of the Company’s reporting units is determined using a combination of valuation techniques, including a discounted cash flow methodology. To corroborate the discounted cash flow analysis performed at each reporting unit, a market approach is utilized using observable market data such as comparable companies in similar lines of business that are publicly traded or which are part of a public or private transaction (to the extent available). Results of the annual impairment test performed as of January 31, 2019, indicated that the fair value of each reporting unit exceeded its carrying amount and no reporting units were at risk of failing the impairment test. As a result, no impairment charge was recognized. There was also no indication of potential impairment during the fourth quarter of fiscal 2019 that would have required further testing.
Intangible assets primarily consist of customer lists, non-compete agreements, proprietary databases and IP. Intangible assets are recorded at their estimated fair value at the date of acquisition and are amortized in a pattern in which the asset is consumed if that pattern can be reliably determined, or using the straight-line method over their estimated useful lives, which range from one to 24 years. For intangible assets subject to amortization, an impairment loss is recognized if the carrying amount of the intangible assets is not recoverable and exceeds fair value. The carrying amount of the intangible assets is considered not recoverable if it exceeds the sum of the undiscounted cash flows expected to result from use of the asset. During fiscal 2018, intangible assets with indefinite lives were not amortized, but were reviewed annually for impairment or more frequently whenever events or changes in circumstances indicated that the fair value of the asset may be less than its carrying amount. As of April 30, 2019 and 2018, there were no further indicators of impairment with respect to the Company’s intangible assets, with the exception of the intangible asset impairment charge discussed below.
F-13
KORN FERRY AND SUBSIDIARIES
NOTES TO CONSOLIDATED FINANCIAL STATEMENTS
April 30, 2019 (continued)
As described above, on June 12, 2018, the Company’s Board of Directors voted to approve the Plan. This integrated go-to-market approach was a key driver in our fee revenue growth in fiscal 2018, which led to the decision to further integrate our go-to-market activities under one master brand — Korn Ferry. As a result, the Company discontinued the use of all sub-brands. Two of the Company’s sub-brands, Hay Group and Lominger, came to Korn Ferry through acquisitions. In connection with the accounting for these acquisitions, $106.6 million of the purchase price was allocated to indefinite-lived tradename intangible assets. As a result of the decision to discontinue their use, the Company took a non-cash intangible asset impairment charge of $106.6 million during fiscal 2019, recorded in general and administrative expenses.
Compensation and Benefits Expense
Compensation and benefits expense in the accompanying consolidated statements of income consist of compensation and benefits paid to consultants (employees who originate business), executive officers and administrative and support personnel. The most significant portions of this expense are salaries and the amounts paid under the annual performance-related bonus plan to employees. The portion of the expense applicable to salaries is comprised of amounts earned by employees during a reporting period. The portion of the expenses applicable to annual performance-related bonuses refers to the Company’s annual employee performance-related bonus with respect to a fiscal year, the amount of which is communicated and paid to each eligible employee following the completion of the fiscal year.
Each quarter, management makes its best estimate of its annual performance-related bonuses, which requires management to, among other things, project annual consultant productivity (as measured by engagement fees billed and collected by executive search consultants and revenue and other performance/profitability metrics for Advisory and RPO & Professional Search consultants), the level of engagements referred by a consultant in one line of business to a different line of business, and Company performance, including profitability, competitive forces and future economic conditions and their impact on the Company’s results. At the end of each fiscal year, annual performance related bonuses take into account final individual consultant productivity (including referred work), Company/line of business results including profitability, the achievement of strategic objectives, the results of individual performance appraisals and the current economic landscape. Accordingly, each quarter the Company reevaluates the assumptions used to estimate annual performance related bonus liability and adjusts the carrying amount of the liability recorded on the consolidated balance sheet and reports any changes in the estimate in current operations.
Because annual performance-based bonuses are communicated and paid only after the Company reports its full fiscal year results, actual performance-based bonus payments may differ from the prior year’s estimate. Such changes in the bonus estimate historically have been immaterial and are recorded in current operations in the period in which they are determined. The performance-related bonus expense was $257.3 million, $220.4 million and $179.6 million for the years ended April 30, 2019, 2018 and 2017, respectively, included in compensation and benefits expense in the consolidated statements of income.
Other expenses included in compensation and benefits expense are due to changes in deferred compensation and pension plan liabilities, changes in cash surrender value (“CSV”) of company-owned life insurance (“COLI”) contracts, amortization of stock compensation awards, payroll taxes and employee insurance benefits. Unearned compensation on the consolidated balance sheets includes long-term retention awards that are generally amortized over four-to-five years.
Deferred Compensation and Pension Plans
For financial accounting purposes, the Company estimates the present value of the future benefits payable under the deferred compensation and pension plans as of the estimated payment commencement date. The Company also estimates the remaining number of years a participant will be employed by the Company. Then, each year during the period of estimated employment, the Company accrues a liability and recognizes expense for a portion of the future benefit using the unit credit cost method for the Senior Executive Incentive Plan (“SEIP”), Wealth Accumulation Plan (“WAP”), Enhanced Wealth Accumulation Plan (“EWAP”) and Worldwide Executive Benefit Plan (“WEB”) and the pension plan acquired under Legacy Hay, while the medical and life insurance plan and Long Term Performance Unit Plan (“LTPU Plan”) uses the projected unit credit cost method. The amounts charged to operations are made up of service and interest costs and the expected return on plan assets. Actuarial gains and losses are initially recorded in accumulated other comprehensive income (loss). The actuarial gains/losses included in accumulated other
F-14
KORN FERRY AND SUBSIDIARIES
NOTES TO CONSOLIDATED FINANCIAL STATEMENTS
April 30, 2019 (continued)
comprehensive income are amortized to the consolidated statements of income, if at the beginning of the year, the amount exceeds 10% of the greater of the projected benefit obligation and market-related plan assets. The amortization included in periodic benefit cost is divided by the average remaining service of inactive plan participants, or the period for which benefits will be paid, if shorter. The expected return on plan assets takes into account the current fair value of plan assets and reflects the Company’s estimate for trust asset returns given the current asset allocation and any expected changes to the asset allocation and current and future market conditions.
In calculating the accrual for future benefit payments, management has made assumptions regarding employee turnover, participant vesting, violation of non-competition provisions and the discount rate. Management periodically reevaluates all assumptions. If assumptions change in future reporting periods, the changes may impact the measurement and recognition of benefit liabilities and related compensation expense.
Executive Capital Accumulation Plan
The Company, under the ECAP, makes discretionary contributions and such contributions may be granted to key employees annually based on the employee’s performance. Certain key management may also receive Company contributions upon commencement of employment. The Company amortizes these contributions on a straight-line basis as they vest, generally over a four to five-year period. The amounts that are expected to be paid to employees over the next 12 months are classified as a current liability included in compensation and benefits payable in the accompanying consolidated balance sheets.
The ECAP is accounted for whereby the changes in the fair value of the vested amounts owed to the participants are adjusted with a corresponding charge (or credit) to compensation and benefits costs.
Cash Surrender Value of Life Insurance
The Company purchased COLI policies or contracts insuring the lives of certain employees eligible to participate in certain of the deferred compensation and pension plans as a means of funding benefits under such plans. The Company purchased both fixed and variable life insurance contracts and does not purchase “split-dollar” life insurance policy contracts. The Company only holds contracts or policies that provide for a fixed or guaranteed rate of return. The CSV of these COLI contracts are carried at the amounts that would be realized if the contract were surrendered at the balance sheet date, net of the outstanding loans from the insurer. The Company has the intention and ability to continue to hold these COLI policies and contracts. Additionally, the loans secured by the policies do not have any scheduled payment terms and the Company also does not intend to repay the loans outstanding on these policies until death benefits under the policy have been realized. Accordingly, the investment in COLI is classified as long-term in the accompanying consolidated balance sheets.
The change in the CSV of COLI contracts, net of insurance premiums paid and gains realized, is reported net in compensation and benefits expense. As of April 30, 2019 and 2018, the Company held contracts with net CSV of $126.0 million and $120.1 million, respectively. If the issuing insurance companies were to become insolvent, the Company would be considered a general creditor; therefore, these assets are subject to credit risk. Management, together with its outside advisors, routinely monitors the claims paying abilities of these insurance companies.
Restructuring Charges, Net
The Company accounts for its restructuring charges as a liability when the obligations are incurred and records such charges at fair value. Such charges include one-time employee termination benefits and the cost to terminate an office lease, including remaining lease payments. Changes in the estimates of the restructuring charges are recorded in the period the change is determined.
Stock-Based Compensation
The Company has employee compensation plans under which various types of stock-based instruments are granted. These instruments principally include restricted stock units, restricted stock and an Employee Stock Purchase Plan (“ESPP”). The Company recognizes compensation expense related to restricted stock units, restricted stock and the estimated fair value of stock purchases under the ESPP on a straight-line basis over the service period for the entire award.
F-15
KORN FERRY AND SUBSIDIARIES
NOTES TO CONSOLIDATED FINANCIAL STATEMENTS
April 30, 2019 (continued)
Translation of Foreign Currencies
Generally, financial results of the Company’s foreign subsidiaries are measured in their local currencies. Assets and liabilities are translated into U.S. dollars at exchange rates in effect at the balance sheet date, while revenue and expenses are translated at weighted-average exchange rates during the fiscal year. Resulting translation adjustments are recorded as a component of accumulated comprehensive income. Gains and losses from foreign currency transactions of the Company’s foreign subsidiaries and the translation of the financial results of subsidiaries operating in highly inflationary economies are included in general and administrative expense in the period incurred. During fiscal 2019 and 2018, the Company recorded foreign currency losses of $1.7 million and $3.3 million, respectively, in general and administrative expenses in the consolidated statements of income. During fiscal 2017, we recorded foreign currency gains of $0.3 million in general and administrative expenses in the consolidated statements of income.
Income Taxes
There are two components of income tax expense: current and deferred. Current income tax expense (benefit) approximates taxes to be paid or refunded for the current period. Deferred income tax expense (benefit) results from changes in deferred tax assets and liabilities between periods. These gross deferred tax assets and liabilities represent decreases or increases in taxes expected to be paid in the future because of future reversals of temporary differences in the basis of assets and liabilities as measured by tax laws and their basis as reported in the consolidated financial statements. Deferred tax assets are also recognized for tax attributes such as net operating loss carryforwards and tax credit carryforwards. Deferred tax assets and deferred tax liabilities are presented net on the consolidated balance sheets by tax jurisdiction. Valuation allowances are then recorded to reduce deferred tax assets to the amounts management concludes are more likely than not to be realized.
Income tax benefits are recognized and measured based upon a two-step model: (1) a tax position must be more-likely-than-not to be sustained based solely on its technical merits in order to be recognized and (2) the benefit is measured as the largest dollar amount of that position that is more-likely-than-not to be sustained upon settlement. The difference between the benefit recognized for a position and the tax benefit claimed on a tax return is referred to as an unrecognized tax benefit. The Company records income tax-related interest and penalties within income tax expense.
Concentration of Credit Risk
Financial instruments that potentially subject the Company to concentrations of credit risk consist principally of cash, cash equivalents, investments, foreign currency forward contracts, interest rate swap, receivables due from clients and net CSV due from insurance companies, which are discussed above. Cash equivalents include investments in money market securities while investments include mutual funds. Investments are diversified throughout many industries and geographic regions. The Company conducts periodic reviews of its customers’ financial condition and customer payment practices to minimize collection risk on accounts receivable. At April 30, 2019 and 2018, the Company had no other significant credit concentrations.
Reclassifications
Certain reclassifications have been made to the amounts in prior periods in order to conform to the current period’s presentation.
Recently Adopted Accounting Standards
In May 2014, the Financial Accounting Standards Board (“FASB”) issued ASC 606, which superseded revenue recognition requirements regarding contracts with customers to transfer goods or services or for the transfer of nonfinancial assets. Under this guidance, entities are required to recognize revenue that depicts the transfer of promised goods or services to customers in an amount that reflects the consideration to which the entity expects to be entitled in exchange for those goods or services. The transfer is considered to occur when the customer obtains control of the goods or services delivered. The guidance provides a five-step analysis to be performed on transactions to determine when and how revenue is recognized. The new guidance became effective for fiscal years and interim periods within those annual years beginning after December 15, 2017. The Company adopted ASC 606 in its fiscal year beginning May 1, 2018 using the modified retrospective transition method with respect to those contracts still outstanding and not completed as of May 1, 2018.
F-16
KORN FERRY AND SUBSIDIARIES
NOTES TO CONSOLIDATED FINANCIAL STATEMENTS
April 30, 2019 (continued)
The Company recognized the cumulative effect of initially applying the new guidance as an adjustment to the opening balance of retained earnings. The comparative periods have not been restated and continue to be reported under the revenue accounting standards in effect for those periods. As a result of the adoption, the Company recorded an increase to retained earnings of $6.7 million, net of tax as of May 1, 2018 due to the cumulative impact of adopting ASC 606. The change in total assets was recorded to unbilled receivables which is included in receivables due from clients; the changes in total liabilities was recorded to income taxes payable, deferred tax liabilities and deferred revenue, which is included in other accrued liabilities.
The following table summarizes the effect of changes made to our consolidated balance sheet at May 1, 2018:
|
|
|
|
|
|
|
Adjustments |
|
|
|
|
|
|
|
|
|
April 30, 2018 |
|
|
due to ASC 606 |
|
|
May 1, 2018 |
|
|||
|
|
|
(in thousands) |
|
|||||||||
|
Total assets |
|
$ |
2,287,914 |
|
|
$ |
3,496 |
|
|
$ |
2,291,410 |
|
|
Total liabilities |
|
$ |
1,068,299 |
|
|
$ |
(3,160 |
) |
|
$ |
1,065,139 |
|
|
Total stockholders’ equity |
|
$ |
1,219,615 |
|
|
$ |
6,656 |
|
|
$ |
1,226,271 |
|
The adjustments primarily relate to uptick revenue (uptick revenue occurs when a placement’s actual compensation is higher than the original estimated compensation) and certain Korn Ferry products that are now considered Functional IP. Under the new standard, uptick revenue is considered variable consideration and estimated at contract inception using the expected value method and recognized over the service period. Previously, the Company recognized uptick revenue as the amount became fixed or determinable. Under the new standard, certain products are now considered Functional IP as delivery of IP content fulfills the performance obligation, and revenue is recognized upon delivery and when an enforceable right to payment exists. Previously these products were considered term licenses and revenue was recognized ratably over the contract term.
In August 2016, the FASB issued guidance on the classification of certain cash receipts and cash payments in the statement of cash flows. The new guidance provides clarification on specific cash flow issues regarding presentation and classification in the statement of cash flows with the objective of reducing the existing diversity in practice. The amendments in this update are effective for reporting periods beginning after December 15, 2017 and were adopted by the Company effective May 1, 2018. The adoption of this guidance did not have an impact on the Company’s consolidated financial statements.
In January 2017, the FASB issued guidance that clarifies the definition of a business. The new guidance assists a company when evaluating whether transactions should be accounted for as acquisitions (disposals) of assets or businesses. The provisions of the guidance require that if the fair value of the gross assets acquired (or disposed of) is substantially concentrated in a single identifiable asset or a group of similar identifiable assets, then it is not a business. The provisions of the guidance are to be applied prospectively. The provisions of the guidance are effective for annual years beginning after December 15, 2017 and were adopted by the Company effective May 1, 2018. The adoption of this guidance did not have an impact on the Company’s consolidated financial statements.
In March 2017, the FASB issued guidance that changes the presentation of net periodic pension cost and net periodic postretirement benefit cost. The new guidance will change the presentation of net periodic benefit cost related to employer-sponsored defined benefit plans and other postretirement benefits. Service cost will be included within the same income statement line item as other compensation costs arising from services rendered during the period, while other components of net periodic benefit pension cost will be presented separately outside of operating income. Additionally, only service costs may be capitalized in assets. This pronouncement is effective for annual reporting periods beginning after December 15, 2017 and was adopted by the Company effective May 1, 2018. The change to the consolidated statements of income has been reflected on a retrospective basis and had no effect on net income. Prior period amounts were revised, which resulted in a decrease in compensation expense and other income of $4.6 million and $0.4 million, respectively, and an increase in interest expense of $4.2 million, in fiscal 2018. For fiscal 2017, this resulted in a decrease in compensation expense and other income of $5.8 million and $1.5 million, respectively, and an increase in interest expense of $4.4 million (see Note 6—Deferred Compensation and Retirement Plans).
F-17
KORN FERRY AND SUBSIDIARIES
NOTES TO CONSOLIDATED FINANCIAL STATEMENTS
April 30, 2019 (continued)
In May 2017, the FASB issued guidance clarifying the scope of modification accounting for stock compensation. The new standard provides guidance about which changes to the terms or conditions of a share-based payment award require an entity to apply modification accounting in Topic 718. This pronouncement is effective for annual reporting periods beginning after December 15, 2017 and was adopted by the Company effective May 1, 2018. The adoption of this guidance did not have an impact on the Company’s consolidated financial statements. Any future impact of this guidance will be dependent on future modification including the number of awards modified.
In February 2018, the FASB issued guidance that provides companies the option to reclassify stranded tax effects from accumulated other comprehensive (loss) income to retained earnings. The new guidance requires companies to disclose whether they decided to reclassify the income tax effects of the Tax Cuts and Jobs Act of 2017 (the “Tax Act”) from accumulated other comprehensive income (loss) to retained earnings. The guidance is effective for annual reporting periods beginning after December 15, 2018, but early adoption is permitted. The Company early adopted effective May 1, 2018, upon the adoption of this guidance we recorded an increase of $2.2 million to retained earnings due to the reclassification from accumulated other comprehensive (loss) income to retained earnings in the period of adoption.
In August 2018, the FASB issued guidance amending and modifying the disclosure requirements for employers that sponsor defined benefit pension or other postretirement pension plans. The amendment removes disclosures to pension plans and other postretirement benefit plans that are no longer considered beneficial and adds disclosure requirements deemed relevant. The amendments of this standard are effective for fiscal years ending after December 15, 2020 with early adoption permitted. The Company early adopted the standard in the fourth quarter of fiscal 2019. The adoption of this guidance did not have an impact on the Company’s consolidated financial statements (see Note 6—Deferred Compensation and Retirement Plans).
Recently Proposed Accounting Standards - Not Yet Adopted
In February 2016, the FASB issued guidance on accounting for leases that generally requires all leases to be recognized on the consolidated balance sheet. The provisions of the guidance are effective for fiscal years beginning after December 15, 2018 and early adoption is permitted. The Company plans to adopt this guidance in fiscal year beginning May 1, 2019. The provisions of the guidance are to be applied using a modified retrospective approach. On July 30, 2018, the FASB issued an amendment that allows entities to apply the provisions at the effective date without adjusting comparative periods. The FASB has also issued subsequent related ASUs, which detail amendments to the ASU, implementation considerations, narrow-scope improvements and practical expedients. The Company has elected to apply the group of practical expedients which allows the Company to carry forward its identification of contracts that are or contain leases, its historical lease classification and its initial direct costs for existing leases. The Company has also elected to combine lease and non-lease components for all asset classes and recognize leases with an initial term of 12 months on a straight-line basis without recognizing a right-to-use asset or operating lease liability. The Company is in the process of finalizing the data validation and associated internal controls for its selected global lease management system. We currently estimate that the adoption of this standard will result in the recording of a material right-of-use asset and a material operating lease liability, as well as enhanced disclosures. We do not expect the adoption of this standard to have an impact on the Company’s consolidated statements of income, consolidated statements of stockholders’ equity, or consolidated statements of cash flows.
In June 2016, the FASB issued guidance on accounting for measurement of credit losses on financial Instruments, which amends the impairment model by requiring entities to use a forward-looking approach based on expected losses to estimate credit losses on certain types of financial instruments, including trade receivables. The standard is effective for fiscal years beginning after December 15, 2019. The Company will adopt this guidance in its fiscal year beginning May 1, 2020. The adoption of this guidance is not anticipated to have a material impact on the consolidated financial statements.
F-18
KORN FERRY AND SUBSIDIARIES
NOTES TO CONSOLIDATED FINANCIAL STATEMENTS
April 30, 2019 (continued)
In January 2017, the FASB issued guidance simplifying the test for goodwill impairment. The new guidance simplifies the test for goodwill impairment by removing Step 2 from the goodwill impairment test. Companies will now perform the goodwill impairment test by comparing the fair value of a reporting unit with its carrying amount, recognizing an impairment charge for the amount by which the carrying amount exceeds the reporting unit’s fair value not to exceed the total amount of goodwill allocated to that reporting unit. An entity still has the option to perform the qualitative assessment for a reporting unit to determine if the quantitative impairment test is necessary. The amendments of this standard are effective for goodwill impairment tests in fiscal years beginning after December 15, 2019, with early adoption permitted for goodwill impairment tests performed after January 1, 2017. The Company is evaluating the adoption timeline and the effects that the standard will have on the consolidated financial statements.
In August 2017, the FASB issued guidance amending and simplifying accounting for hedging activities. The new guidance will refine and expand strategies that qualify for hedge accounting and simplify the application of hedge accounting in certain situations. The amendments of this standard are effective for fiscal years beginning after December 15, 2018. The Company will adopt this guidance in its fiscal year beginning May 1, 2019. The Company is currently evaluating the impact of adopting this guidance.
In August 2018, the FASB issued guidance amending the disclosure requirements for fair value measurements. The amendment removes and modifies disclosures that are currently required and adds additional disclosures that are deemed relevant. The amendments of this standard are effective for fiscal years beginning after December 15, 2019. The Company will adopt this guidance in its fiscal year beginning May 1, 2020. The Company is currently evaluating the impact of adopting this guidance.
In August 2018, the FASB issued guidance amending accounting for internal-use software. The new guidance will align the requirements for capitalizing implementation costs incurred in a hosting arrangement that is a service contract with developing or obtaining internal-use software. The amendments of this standard are effective for fiscal years ending after December 15, 2019 with early adoption permitted. The Company will adopt this guidance in its fiscal year beginning May 1, 2020. The Company is currently evaluating the impact of adopting this guidance.
2. Basic and Diluted Earnings Per Share
Accounting Standards Codification 260, Earnings Per Share, requires companies to treat unvested share-based payment awards that have non-forfeitable rights to dividends prior to vesting as a separate class of securities in calculating earnings per share. The Company has granted and expects to continue to grant to certain employees under its restricted stock agreements, grants that contain non-forfeitable rights to dividends. Such grants are considered participating securities. Therefore, the Company is required to apply the two-class method in calculating earnings per share. The two-class method of computing earnings per share is an earnings allocation formula that determines earnings per share for each class of common stock and participating security according to dividends declared (or accumulated) and participation rights in undistributed earnings. The dilutive effect of participating securities is calculated using the more dilutive of the treasury method or the two-class method.
Basic earnings per common share was computed using the two-class method by dividing basic net earnings attributable to common stockholders by the weighted-average number of common shares outstanding. Diluted earnings per common share was computed using the two-class method by dividing diluted net earnings attributable to common stockholders by the weighted-average number of common shares outstanding plus dilutive common equivalent shares. Dilutive common equivalent shares include all in-the-money outstanding options or other contracts to issue common stock as if they were exercised or converted. Financial instruments that are not in the form of common stock, but when converted into common stock increase earnings per share, are anti-dilutive and are not included in the computation of diluted earnings per share.
During fiscal 2019, 2018 and 2017, restricted stock awards of 0.6 million shares, 0.6 million shares and 0.5 million shares, respectively, were outstanding but not included in the computation of diluted earnings per share because they were anti-dilutive.
F-19
KORN FERRY AND SUBSIDIARIES
NOTES TO CONSOLIDATED FINANCIAL STATEMENTS
April 30, 2019 (continued)
The following table summarizes basic and diluted earnings per common share attributable to common stockholders:
|
|
|
Year Ended April 30, |
|
|||||||||
|
|
|
2019 |
|
|
2018 |
|
|
2017 |
|
|||
|
|
|
(in thousands, except per share data) |
|
|||||||||
|
Net income attributable to Korn Ferry |
|
$ |
102,651 |
|
|
$ |
133,779 |
|
|
$ |
84,181 |
|
|
Less: distributed and undistributed earnings to nonvested restricted stockholders |
|
|
1,066 |
|
|
|
1,426 |
|
|
|
765 |
|
|
Basic net earnings attributable to common stockholders |
|
|
101,585 |
|
|
|
132,353 |
|
|
|
83,416 |
|
|
Add: undistributed earnings to nonvested restricted stockholders |
|
|
831 |
|
|
|
1,187 |
|
|
|
560 |
|
|
Less: reallocation of undistributed earnings to nonvested restricted stockholders |
|
|
820 |
|
|
|
1,169 |
|
|
|
553 |
|
|
Diluted net earnings attributable to common stockholders |
|
$ |
101,596 |
|
|
$ |
132,371 |
|
|
$ |
83,423 |
|
|
|
|
|
|
|
|
|
|
|
|
|
|
|
|
Weighted-average common shares outstanding: |
|
|
|
|
|
|
|
|
|
|
|
|
|
Basic weighted-average number of common shares outstanding |
|
|
55,311 |
|
|
|
55,426 |
|
|
|
56,205 |
|
|
Effect of dilutive securities: |
|
|
|
|
|
|
|
|
|
|
|
|
|
Restricted stock |
|
|
750 |
|
|
|
822 |
|
|
|
646 |
|
|
ESPP |
|
|
34 |
|
|
|
5 |
|
|
|
24 |
|
|
Stock options |
|
|
1 |
|
|
|
1 |
|
|
|
25 |
|
|
Diluted weighted-average number of common shares outstanding |
|
|
56,096 |
|
|
|
56,254 |
|
|
|
56,900 |
|
|
|
|
|
|
|
|
|
|
|
|
|
|
|
|
Net earnings per common share: |
|
|
|
|
|
|
|
|
|
|
|
|
|
Basic earnings per share |
|
$ |
1.84 |
|
|
$ |
2.39 |
|
|
$ |
1.48 |
|
|
Diluted earnings per share |
|
$ |
1.81 |
|
|
$ |
2.35 |
|
|
$ |
1.47 |
|
3. Comprehensive Income
Comprehensive income is comprised of net income and all changes to stockholders’ equity, except those changes resulting from investments by stockholders (changes in paid-in capital) and distributions to stockholders (dividends) and is reported in the accompanying consolidated statements of comprehensive income. Accumulated other comprehensive income (loss), net of taxes, is recorded as a component of stockholders’ equity.
The components of accumulated other comprehensive (loss) income were as follows:
|
|
|
April 30, |
|
|||||
|
|
|
2019 |
|
|
2018 |
|
||
|
|
|
(in thousands) |
|
|||||
|
Foreign currency translation adjustments |
|
$ |
(60,270 |
) |
|
$ |
(32,399 |
) |
|
Deferred compensation and pension plan adjustments, net of taxes |
|
|
(16,838 |
) |
|
|
(9,073 |
) |
|
Interest rate swap unrealized gain, net of taxes |
|
|
456 |
|
|
|
1,337 |
|
|
Accumulated other comprehensive loss, net |
|
$ |
(76,652 |
) |
|
$ |
(40,135 |
) |
F-20
KORN FERRY AND SUBSIDIARIES
NOTES TO CONSOLIDATED FINANCIAL STATEMENTS
April 30, 2019 (continued)
The following table summarizes the changes in each component of accumulated other comprehensive (loss) income:
|
|
|
Foreign Currency Translation |
|
|
Deferred Compensation and Pension Plan (1) |
|
|
Unrealized (Losses) Gains on Interest Rate Swap (2) |
|
|
Accumulated Other Comprehensive Income (Loss) |
|
||||
|
|
|
|
|
|
|
(in thousands) |
|
|
|
|
|
|||||
|
Balance as of May 1, 2016 |
|
$ |
(36,339 |
) |
|
$ |
(21,572 |
) |
|
$ |
— |
|
|
$ |
(57,911 |
) |
|
Unrealized (losses) gains arising during the period |
|
|
(19,020 |
) |
|
|
4,584 |
|
|
|
(635 |
) |
|
|
(15,071 |
) |
|
Reclassification of realized net losses to net income |
|
|
— |
|
|
|
1,861 |
|
|
|
57 |
|
|
|
1,918 |
|
|
Balance as of April 30, 2017 |
|
|
(55,359 |
) |
|
|
(15,127 |
) |
|
|
(578 |
) |
|
|
(71,064 |
) |
|
Unrealized gains arising during the period |
|
|
22,960 |
|
|
|
4,813 |
|
|
|
1,465 |
|
|
|
29,238 |
|
|
Reclassification of realized net losses to net income |
|
|
— |
|
|
|
1,241 |
|
|
|
450 |
|
|
|
1,691 |
|
|
Balance as of April 30, 2018 |
|
|
(32,399 |
) |
|
|
(9,073 |
) |
|
|
1,337 |
|
|
|
(40,135 |
) |
|
Unrealized losses arising during the period |
|
|
(27,871 |
) |
|
|
(6,461 |
) |
|
|
(800 |
) |
|
|
(35,132 |
) |
|
Reclassification of realized losses (gains) to net income |
|
|
— |
|
|
|
1,092 |
|
|
|
(280 |
) |
|
|
812 |
|
|
Effect of adoption of accounting standard |
|
|
— |
|
|
|
(2,396 |
) |
|
|
199 |
|
|
|
(2,197 |
) |
|
Balance as of April 30, 2019 |
|
$ |
(60,270 |
) |
|
$ |
(16,838 |
) |
|
$ |
456 |
|
|
$ |
(76,652 |
) |
|
(1) |
The tax effects on unrealized (losses) gains were $(2.3) million, $2.5 million and $1.9 million as of April 30, 2019, 2018 and 2017, respectively. The tax effects on reclassifications of realized net losses were $0.4 million, $0.8 million and $1.2 million as of April 30, 2019, 2018 and 2017, respectively. |
|
(2) |
The tax effects on unrealized (losses) gains were $(0.3) million, $0.8 million and $(0.4) million as of April 30, 2019, 2018 and 2017, respectively. The tax effect on the reclassification of realized net gains (losses) to net income was $0.1 million and $(0.3) million as of April 30, 2019 and 2018, respectively. |
4. Employee Stock Plans
Stock-Based Compensation
The following table summarizes the components of stock-based compensation expense recognized in the Company’s consolidated statements of income for the periods indicated:
|
|
|
Year Ended April 30, |
|
|||||||||
|
|
|
2019 |
|
|
2018 |
|
|
2017 |
|
|||
|
|
|
(in thousands) |
|
|||||||||
|
Restricted stock |
|
$ |
22,063 |
|
|
$ |
20,282 |
|
|
$ |
18,045 |
|
|
ESPP |
|
|
1,322 |
|
|
|
1,187 |
|
|
|
913 |
|
|
Total stock-based compensation expense, pre-tax |
|
|
23,385 |
|
|
|
21,469 |
|
|
|
18,958 |
|
|
Tax benefit from stock-based compensation expense |
|
|
(5,155 |
) |
|
|
(7,319 |
) |
|
|
(4,756 |
) |
|
Total stock-based compensation expense, net of tax |
|
$ |
18,230 |
|
|
$ |
14,150 |
|
|
$ |
14,202 |
|
Stock Incentive Plan
At the Company’s 2016 Annual Meeting of Stockholders, held on October 6, 2016, the Company’s stockholders approved an amendment and restatement to the Korn Ferry Amended and Restated 2008 Stock Incentive Plan (the 2016 amendment and restatement being “The Third A&R 2008 Plan”), which among other things, increased the number of shares under the plan by 5,500,000, increasing the current maximum number of shares that may be issued under the plan to 11,200,000 shares, subject to certain changes in the Company’s capital structure and other extraordinary events. The Third A&R 2008 Plan provides for the grant of awards to eligible participants, designated as either nonqualified or incentive stock options, restricted stock and restricted stock units, any of which may be performance-based or market-based, and incentive bonuses, which may be paid in cash or stock or a combination thereof. Under the Third A&R 2008 Plan, the ability to issue full-value awards is limited by requiring full-value stock awards to count 2.3 times as much as stock options.
F-21
KORN FERRY AND SUBSIDIARIES
NOTES TO CONSOLIDATED FINANCIAL STATEMENTS
April 30, 2019 (continued)
The Company grants time-based restricted stock awards to executive officers and other senior employees generally vesting over a four-year period. In addition, certain key management members typically receive time-based restricted stock awards upon commencement of employment and may receive them annually in conjunction with the Company’s performance review. Time-based restricted stock awards are granted at a price equal to fair value, which is determined based on the closing price of the Company’s common stock on the grant date. The Company recognizes compensation expense for time-based restricted stock awards on a straight-line basis over the vesting period.
The Company also grants market-based and performance-based restricted stock units to executive officers and other senior employees. The market-based units vest after three years depending upon the Company’s total stockholder return over the three-year performance period relative to other companies in its selected peer group. The fair value of these market-based restricted stock units are determined by using extensive market data that is based on historical Company and peer group information. The Company recognizes compensation expense for market-based restricted stock units on a straight-line basis over the vesting period.
Performance-based restricted stock units vest after three years, depending upon the Company meeting certain objectives that are set at the time the restricted stock unit is issued. Performance-based restricted stock units are granted at a price equal to fair value, which is determined based on the closing price of the Company’s common stock on the grant date. At the end of each reporting period, the Company estimates the number of restricted stock units expected to vest, based on the probability that certain performance objectives will be met, exceeded, or fall below target levels, and the Company takes into account these estimates when calculating the expense for the period. As of April 30, 2019, no performance-based shares were outstanding.
Restricted stock activity is summarized below:
|
|
|
April 30, |
|
|||||||||||||||||||||
|
|
|
2019 |
|
|
2018 |
|
|
2017 |
|
|
|
|
|
|||||||||||
|
|
|
Shares |
|
|
Weighted- Average Grant Date Fair Value |
|
|
Shares |
|
|
Weighted- Average Grant Date Fair Value |
|
|
Shares |
|
|
Weighted- Average Grant Date Fair Value |
|
||||||
|
|
|
(in thousands, except per share data) |
|
|||||||||||||||||||||
|
Non-vested, beginning of year |
|
|
1,730 |
|
|
$ |
33.45 |
|
|
|
1,581 |
|
|
$ |
29.74 |
|
|
|
1,506 |
|
|
$ |
34.12 |
|
|
Granted |
|
|
671 |
|
|
$ |
40.93 |
|
|
|
650 |
|
|
$ |
37.60 |
|
|
|
852 |
|
|
$ |
17.43 |
|
|
Vested |
|
|
(904 |
) |
|
$ |
36.41 |
|
|
|
(431 |
) |
|
$ |
26.13 |
|
|
|
(751 |
) |
|
$ |
24.15 |
|
|
Forfeited |
|
|
(37 |
) |
|
$ |
32.26 |
|
|
|
(70 |
) |
|
$ |
33.26 |
|
|
|
(26 |
) |
|
$ |
26.80 |
|
|
Non-vested, end of year |
|
|
1,460 |
|
|
$ |
38.42 |
|
|
|
1,730 |
|
|
$ |
33.45 |
|
|
|
1,581 |
|
|
$ |
29.74 |
|
As of April 30, 2019, there were 0.6 million shares outstanding relating to market-based restricted stock units with total unrecognized compensation totaling $11.0 million.
As of April 30, 2019, there was $35.0 million of total unrecognized compensation cost related to all non-vested awards of restricted stock, which is expected to be recognized over a weighted-average period of 2.4 years. During fiscal 2019 and 2018, 356,879 shares and 108,089 shares of restricted stock totaling $20.7 million and $3.8 million, respectively, were repurchased by the Company, at the option of the employee, to pay for taxes related to the vesting of restricted stock.
Employee Stock Purchase Plan
The Company has an ESPP that, in accordance with Section 423 of the Internal Revenue Code, allows eligible employees to authorize payroll deductions of up to 15% of their salary to purchase shares of the Company’s common stock at 85% of the fair market price of the common stock on the last day of the enrollment period. Employees may not purchase more than $25,000 in stock during any calendar year. The maximum number of shares that may be issued under the ESPP is 3.0 million shares. During fiscal 2019, 2018, and 2017, employees purchased 169,299 shares at $42.05 per share, 198,749 shares at $31.77 per share and 207,141 shares at $20.93 per share, respectively. As of April 30, 2019, the ESPP had approximately 1.0 million shares remaining available for future issuance.
F-22
KORN FERRY AND SUBSIDIARIES
NOTES TO CONSOLIDATED FINANCIAL STATEMENTS
April 30, 2019 (continued)
During fiscal 2019, 2018 and 2017, the Company issued 6,720 shares, 41,075 shares and 53,955 shares of common stock, respectively, because of the exercise of stock options, with cash proceeds from the exercise of $0.2 million, $0.6 million and $0.8 million, respectively.
During fiscal 2019, 2018 and 2017, the Company repurchased (on the open market or privately negotiated transactions) 809,074 shares, 984,079 shares and 1,140,576 shares, respectively, of the Company’s common stock for $37.4 million $33.1 million and $28.8 million, respectively.
5. Financial Instruments
The following tables show the Company’s financial instruments and balance sheet classification as of April 30, 2019 and 2018:
|
|
|
April 30, 2019 |
|
|||||||||||||||||||||||||||||
|
|
|
Fair Value Measurement |
|
|
Balance Sheet Classification |
|
||||||||||||||||||||||||||
|
|
|
Cost |
|
|
Unrealized Gains |
|
|
Unrealized Losses |
|
|
Fair Value |
|
|
Cash and Cash Equivalents |
|
|
Marketable Securities, Current |
|
|
Marketable Securities, Non- current |
|
|
Income Taxes & Other Receivables |
|
||||||||
|
|
|
(in thousands) |
|
|||||||||||||||||||||||||||||
|
Level 1: |
|
|
|
|
|
|
|
|
|
|
|
|
|
|
|
|
|
|
|
|
|
|
|
|
|
|
|
|
|
|
|
|
|
Cash |
|
$ |
579,998 |
|
|
$ |
— |
|
|
$ |
— |
|
|
$ |
579,998 |
|
|
$ |
579,998 |
|
|
$ |
— |
|
|
$ |
— |
|
|
$ |
— |
|
|
Money market funds |
|
|
46,362 |
|
|
|
— |
|
|
|
— |
|
|
|
46,362 |
|
|
|
46,362 |
|
|
|
— |
|
|
|
— |
|
|
|
— |
|
|
Mutual funds (1) |
|
|
135,439 |
|
|
|
6,301 |
|
|
|
(989 |
) |
|
|
140,751 |
|
|
|
— |
|
|
|
8,288 |
|
|
|
132,463 |
|
|
|
— |
|
|
Total |
|
$ |
761,799 |
|
|
$ |
6,301 |
|
|
$ |
(989 |
) |
|
$ |
767,111 |
|
|
$ |
626,360 |
|
|
$ |
8,288 |
|
|
$ |
132,463 |
|
|
$ |
— |
|
|
|
|
|
|
|
|
|
|
|
|
|
|
|
|
|
|
|
|
|
|
|
|
|
|
|
|
|
|
|
|
|
|
|
|
Level 2: |
|
|
|
|
|
|
|
|
|
|
|
|
|
|
|
|
|
|
|
|
|
|
|
|
|
|
|
|
|
|
|
|
|
Foreign currency forward contracts |
|
$ |
— |
|
|
$ |
821 |
|
|
$ |
(722 |
) |
|
$ |
99 |
|
|
$ |
— |
|
|
$ |
— |
|
|
$ |
— |
|
|
$ |
99 |
|
|
Interest rate swap |
|
$ |
— |
|
|
$ |
619 |
|
|
$ |
— |
|
|
$ |
619 |
|
|
$ |
— |
|
|
$ |
— |
|
|
$ |
— |
|
|
$ |
619 |
|
|
|
|
April 30, 2018 |
|
|||||||||||||||||||||||||||||
|
|
|
Fair Value Measurement |
|
|
Balance Sheet Classification |
|
||||||||||||||||||||||||||
|
|
|
Cost |
|
|
Unrealized Gains |
|
|
Unrealized Losses |
|
|
Fair Value |
|
|
Cash and Cash Equivalents |
|
|
Marketable Securities, Current |
|
|
Marketable Securities, Non- current |
|
|
Income Taxes & Other Receivables |
|
||||||||
|
|
|
(in thousands) |
|
|||||||||||||||||||||||||||||
|
Level 1: |
|
|
|
|
|
|
|
|
|
|
|
|
|
|
|
|
|
|
|
|
|
|
|
|
|
|
|
|
|
|
|
|
|
Cash |
|
$ |
519,818 |
|
|
$ |
— |
|
|
$ |
— |
|
|
$ |
519,818 |
|
|
$ |
519,818 |
|
|
$ |
— |
|
|
$ |
— |
|
|
$ |
— |
|
|
Money market funds |
|
|
1,030 |
|
|
|
— |
|
|
|
— |
|
|
|
1,030 |
|
|
|
1,030 |
|
|
|
— |
|
|
|
— |
|
|
|
— |
|
|
Mutual funds (1) |
|
|
127,077 |
|
|
|
11,040 |
|
|
|
(1,032 |
) |
|
|
137,085 |
|
|
|
— |
|
|
|
14,293 |
|
|
|
122,792 |
|
|
|
— |
|
|
Total |
|
$ |
647,925 |
|
|
$ |
11,040 |
|
|
$ |
(1,032 |
) |
|
$ |
657,933 |
|
|
$ |
520,848 |
|
|
$ |
14,293 |
|
|
$ |
122,792 |
|
|
$ |
— |
|
|
|
|
|
|
|
|
|
|
|
|
|
|
|
|
|
|
|
|
|
|
|
|
|
|
|
|
|
|
|
|
|
|
|
|
Level 2: |
|
|
|
|
|
|
|
|
|
|
|
|
|
|
|
|
|
|
|
|
|
|
|
|
|
|
|
|
|
|
|
|
|
Foreign currency forward contracts |
|
$ |
— |
|
|
$ |
1,778 |
|
|
$ |
(1,025 |
) |
|
$ |
753 |
|
|
$ |
— |
|
|
$ |
— |
|
|
$ |
— |
|
|
$ |
753 |
|
|
Interest rate swap |
|
$ |
— |
|
|
$ |
2,076 |
|
|
$ |
— |
|
|
$ |
2,076 |
|
|
$ |
— |
|
|
$ |
— |
|
|
$ |
— |
|
|
$ |
2,076 |
|
|
(1) |
These investments are held in trust for settlement of the Company’s vested obligations of $122.3 million and $118.2 million as of April 30, 2019 and 2018, respectively, under the ECAP (see Note 6 — Deferred Compensation and Retirement Plans). Unvested obligations under the deferred compensation plans totaled $24.6 million and $29.5 million as of April 30, 2019 and 2018, respectively. During fiscal 2019, 2018, and 2017, the fair value of the investments increased; therefore, the Company recognized income of $8.1 million, $10.3 million, and $10.8 million, respectively, which was recorded in other income, net. |
F-23
KORN FERRY AND SUBSIDIARIES
NOTES TO CONSOLIDATED FINANCIAL STATEMENTS
April 30, 2019 (continued)
Investments in marketable securities are based upon investment selections the employee elects from a pre-determined set of securities in the ECAP and the Company invests in marketable securities to mirror these elections. As of April 30, 2019 and 2018, the Company’s investments in marketable securities consist of mutual funds for which market prices are readily available.
Designated Derivatives - Interest Rate Swap Agreement
In March 2017, the Company entered into an interest rate swap contract with a notional amount of $129.8 million to hedge the variability to changes in cash flows attributable to interest rate risks caused by changes in interest rates related to its variable rate debt. The Company has designated the swap as a cash flow hedge. As of April 30, 2019 the notional amount was $106.6 million. The interest rate swap agreement matures on June 15, 2021 and locks the interest rates on a portion of the debt outstanding at 1.919%, exclusive of the credit spread on the debt.
The fair value of the derivative designated as a cash flow hedge instrument is as follows:
|
|
|
April 30, |
|
|||||
|
|
|
2019 |
|
|
2018 |
|
||
|
|
|
(in thousands) |
|
|||||
|
Derivative asset: |
|
|
|
|
|
|
|
|
|
Interest rate swap contract |
|
$ |
619 |
|
|
$ |
2,076 |
|
During fiscal 2019, 2018 and 2017, the Company recognized the following gains and losses on the interest rate swap:
|
|
|
Year Ended April 30, |
|
|||||||||
|
|
|
2019 |
|
|
2018 |
|
|
2017 |
|
|||
|
|
|
(in thousands) |
|
|||||||||
|
(Losses) gains recognized in other comprehensive income (net of tax effects of ($281), $828, and ($406), respectively) |
|
$ |
(800 |
) |
|
$ |
1,465 |
|
|
$ |
(635 |
) |
|
Gains (losses) reclassified from accumulated other comprehensive income into interest (expense) income, net |
|
$ |
376 |
|
|
$ |
(730 |
) |
|
$ |
(94 |
) |
As the critical terms of the hedging instrument and the hedged forecasted transaction are the same, the Company has concluded the changes in the fair value or cash flows attributable to the risk being hedged are expected to completely offset at inception and on an ongoing basis.
We estimate that $0.4 million of derivative gains included in accumulated other comprehensive income as of April 30, 2019 will be reclassified into interest expense, net within the following 12 months. The cash flows related to interest rate swap contracts are included in net cash provided by operating activities.
Foreign Currency Forward Contracts Not Designated as Hedges
The fair value of derivatives not designated as hedge instruments are as follows:
|
|
|
April 30, |
|
|||||
|
|
|
2019 |
|
|
2018 |
|
||
|
|
|
(in thousands) |
|
|||||
|
Derivative assets: |
|
|
|
|
|
|
|
|
|
Foreign currency forward contracts |
|
$ |
821 |
|
|
$ |
1,778 |
|
|
Derivative liabilities: |
|
|
|
|
|
|
|
|
|
Foreign currency forward contracts |
|
$ |
722 |
|
|
$ |
1,025 |
|
F-24
KORN FERRY AND SUBSIDIARIES
NOTES TO CONSOLIDATED FINANCIAL STATEMENTS
April 30, 2019 (continued)
As of April 30, 2019, the total notional amounts of the forward contracts purchased and sold were $51.4 million and $40.0 million, respectively. As of April 30, 2018, the total notional amounts of the forward contracts purchased and sold were $80.8 million and $78.5 million, respectively. The Company recognizes forward contracts as a net asset or net liability on the consolidated balance sheets as such contracts are covered by master netting agreements. During fiscal 2019 and 2017, the Company incurred gains of $1.2 million and $0.6 million, respectively, related to forward contracts which is recorded in general and administrative expenses in the accompanying consolidated statements of income. These foreign currency gains offset foreign currency losses that result from transactions denominated in a currency other than the Company’s functional currency. During fiscal 2018, the Company incurred losses of $3.7 million related to forward contracts which is recorded in general and administrative expenses in the accompanying consolidated statements of income. These foreign currency losses offset foreign currency gains that result from transactions denominated in a currency other than the Company’s functional currency. The cash flows related to foreign currency forward contracts are included in cash flows from operating activities.
6. Deferred Compensation and Retirement Plans
The Company has several deferred compensation and retirement plans for eligible consultants and vice presidents that provide defined benefits to participants based on the deferral of current compensation or contributions made by the Company subject to vesting and retirement or termination provisions.
The total benefit obligations for these plans were as follows:
|
|
|
Year Ended April 30, |
|
|||||
|
|
|
2019 |
|
|
2018 |
|
||
|
|
|
(in thousands) |
|
|||||
|
Deferred compensation and pension plans |
|
$ |
123,238 |
|
|
$ |
100,404 |
|
|
Medical and Life Insurance plan |
|
|
7,310 |
|
|
|
7,157 |
|
|
International retirement plans |
|
|
14,744 |
|
|
|
13,729 |
|
|
Executive Capital Accumulation Plan |
|
|
130,161 |
|
|
|
128,430 |
|
|
Total benefit obligation |
|
|
275,453 |
|
|
|
249,720 |
|
|
Less: current portion of benefit obligation |
|
|
(17,818 |
) |
|
|
(21,991 |
) |
|
Non-current benefit obligation |
|
$ |
257,635 |
|
|
$ |
227,729 |
|
Deferred Compensation and Pension Plans
The EWAP was established in fiscal 1994, which replaced the WAP. Certain vice presidents elected to participate in a “deferral unit” that required the participant to contribute a portion of their compensation for an eight year period, or in some cases, make an after-tax contribution, in return for defined benefit payments from the Company over a fifteen year period at retirement age of 65 or later. Participants were able to acquire additional “deferral units” every five years. Vice presidents who did not choose to roll over their WAP units into the EWAP continue to be covered under the earlier version in which participants generally vest and commence receipt of benefit payments at retirement age of 65. In June 2003, the Company amended the EWAP and WAP, so as not to allow new participants or the purchase of additional deferral units by existing participants.
The Company also maintains a SEIP for participants approved by the Board. Generally, to be eligible, the vice president must be participating in the EWAP. Participation in the SEIP required the participant to contribute a portion of their compensation during a four-year period, or in some cases make an after-tax contribution, in return for a defined benefit paid by the Company generally over a fifteen year period after ten years of participation in the plan or such later date as elected by the participant. In June 2003, the Company amended the SEIP, so as not to allow new participants or the purchase of additional deferral units by existing participants.
The Company has a defined benefit pension plan, referred to as the WEB, covering certain executives in the U.S. and foreign countries. The WEB is designed to integrate with government sponsored and local benefits and provide a monthly benefit to vice presidents upon retirement from the Company. Each year a plan participant accrued and was fully vested in one-twentieth of the targeted benefits expressed as a percentage set by the Company for that year. Upon retirement, a participant receives a monthly benefit payment equal to the sum of the percentages accrued over such participant’s term of employment, up to a maximum of 20 years, multiplied by the participant’s highest average monthly salary during the 36 consecutive months in the final 72 months of active full-time employment through June 2003. In June 2003, the Company froze the WEB, so as to not allow new participants, future accruals and future salary increases.
F-25
KORN FERRY AND SUBSIDIARIES
NOTES TO CONSOLIDATED FINANCIAL STATEMENTS
April 30, 2019 (continued)
In conjunction with the acquisition of Hay Group, the Company acquired multiple pension and savings plans covering certain of its employees worldwide. Among these plans is a defined benefit pension plan for certain employees in the U.S. The assets of this plan are held separately from the assets of the sponsors in self-administered funds. The plan is funded consistent with local statutory requirements.
On July 8, 2016, the Company established the LTPU Plan in order to promote the success of the Company by providing a select group of management and highly compensated employees with nonqualified supplemental retirement benefits as an additional means to attract, motivate and retain such employees. A unit award has a base value of $50,000 for the purpose of determining the payment that would be made upon early termination for a partially vested unit awards. The units vest 25% on each anniversary date with the unit becoming fully vested on the fourth anniversary of the grant date, subject to the participant’s continued service as of each anniversary date. Each vested unit award will pay out an annual benefit of $25,000 for each of five years commencing on the seventh anniversary of the grant date.
Deferred Compensation and Pension Plans
The following tables reconcile the benefit obligation for the deferred compensation plans:
|
|
|
Year Ended April 30, |
|
|||||
|
|
|
2019 |
|
|
2018 |
|
||
|
|
|
(in thousands) |
|
|||||
|
Change in benefit obligation: |
|
|
|
|
|
|
|
|
|
Benefit obligation, beginning of year |
|
$ |
126,494 |
|
|
$ |
121,042 |
|
|
Service cost |
|
|
17,281 |
|
|
|
11,373 |
|
|
Interest cost |
|
|
5,044 |
|
|
|
3,787 |
|
|
Actuarial loss (gain) |
|
|
7,803 |
|
|
|
(1,574 |
) |
|
Administrative expenses paid |
|
|
(272 |
) |
|
|
(166 |
) |
|
Benefits paid from plan assets |
|
|
(1,877 |
) |
|
|
(1,833 |
) |
|
Benefits paid from cash |
|
|
(6,104 |
) |
|
|
(6,135 |
) |
|
Benefit obligation, end of year |
|
|
148,369 |
|
|
|
126,494 |
|
|
|
|
|
|
|
|
|
|
|
|
Change in fair value of plan assets: |
|
|
|
|
|
|
|
|
|
Fair value of plan assets, beginning of year |
|
|
26,090 |
|
|
|
25,446 |
|
|
Actual return on plan assets |
|
|
1,160 |
|
|
|
2,425 |
|
|
Benefits paid from plan assets |
|
|
(1,877 |
) |
|
|
(1,833 |
) |
|
Administrative expenses paid |
|
|
(272 |
) |
|
|
(166 |
) |
|
Employer contributions |
|
|
30 |
|
|
|
218 |
|
|
Fair value of plan assets, end of year |
|
|
25,131 |
|
|
|
26,090 |
|
|
|
|
|
|
|
|
|
|
|
|
Funded status and balance, end of year (1) |
|
$ |
(123,238 |
) |
|
$ |
(100,404 |
) |
|
|
|
|
|
|
|
|
|
|
|
Current liability |
|
$ |
8,331 |
|
|
$ |
6,496 |
|
|
Non-current liability |
|
|
114,907 |
|
|
|
93,908 |
|
|
Total liability |
|
$ |
123,238 |
|
|
$ |
100,404 |
|
|
|
|
|
|
|
|
|
|
|
|
Plan Assets - weighted-average asset allocation: |
|
|
|
|
|
|
|
|
|
Debt securities |
|
|
54 |
% |
|
|
55 |
% |
|
Equity securities |
|
|
45 |
% |
|
|
44 |
% |
|
Other |
|
|
1 |
% |
|
|
1 |
% |
|
Total |
|
|
100 |
% |
|
|
100 |
% |
|
(1) |
The Company purchased COLI contracts insuring the lives of certain employees eligible to participate in the deferred compensation and pension plans as a means of funding benefits under such plans. As of April 30, 2019 and 2018, the Company held contracts with gross CSV of $219.2 million and $186.8 million, offset by outstanding policy loans of $93.2 million and $66.7 million, respectively. |
F-26
KORN FERRY AND SUBSIDIARIES
NOTES TO CONSOLIDATED FINANCIAL STATEMENTS
April 30, 2019 (continued)
Significant changes affecting pension benefit obligations in 2019 compared to 2018 primarily included actuarial loss in 2019 due to a change in discount rate, update of census data and change in the mortality assumption that affect the assumptions used to value liabilities. The mortality assumption reflects a change from the use of the MP-2017 improvement scale to MP-2018 improvement scale, and from the use of no collar base tables to “top quartile” and white-collar base tables for some of our plans. The fair value measurements of the defined benefit plan assets fall within the following levels of the fair value hierarchy as of April 30, 2019 and 2018:
|
|
|
Level 1 |
|
|
Level 2 |
|
|
Level 3 |
|
|
Total |
|
||||
|
|
|
(in thousands) |
|
|||||||||||||
|
April 30, 2019: |
|
|
|
|
|
|
|
|
|
|
|
|
|
|
|
|
|
Mutual funds |
|
$ |
— |
|
|
$ |
24,931 |
|
|
$ |
— |
|
|
$ |
24,931 |
|
|
Money market funds |
|
|
200 |
|
|
|
— |
|
|
|
— |
|
|
|
200 |
|
|
Total |
|
$ |
200 |
|
|
$ |
24,931 |
|
|
$ |
— |
|
|
$ |
25,131 |
|
|
|
|
|
|
|
|
|
|
|
|
|
|
|
|
|
|
|
|
April 30, 2018: |
|
|
|
|
|
|
|
|
|
|
|
|
|
|
|
|
|
Mutual funds |
|
$ |
— |
|
|
$ |
25,899 |
|
|
$ |
— |
|
|
$ |
25,899 |
|
|
Money market funds |
|
|
191 |
|
|
|
— |
|
|
|
— |
|
|
|
191 |
|
|
Total |
|
$ |
191 |
|
|
$ |
25,899 |
|
|
$ |
— |
|
|
$ |
26,090 |
|
Plan assets are invested in various asset classes that are expected to produce a sufficient level of diversification and investment return over the long term. The investment goal is a return on assets that is at least equal to the assumed actuarial rate of return over the long term within reasonable and prudent levels of risk. Investment policies reflect the unique circumstances of the respective plans and include requirements designed to mitigate risk including quality and diversification standards. Asset allocation targets are reviewed periodically with investment advisors to determine the appropriate investment strategies for acceptable risk levels. Our target allocation ranges are as follows: equity securities 40% to 50%, debt securities 45% to 55% and other assets of 0% to 10%. We establish our estimated long‑term return on plan assets considering various factors, including the targeted asset allocation percentages, historic returns and expected future returns.
The components of net periodic benefits costs are as follows:
|
|
|
Year Ended April 30, |
|
|||||||||
|
|
|
2019 |
|
|
2018 |
|
|
2017 |
|
|||
|
|
|
(in thousands) |
|
|||||||||
|
Service cost |
|
$ |
17,281 |
|
|
$ |
11,373 |
|
|
$ |
5,402 |
|
|
Interest cost |
|
|
5,044 |
|
|
|
3,787 |
|
|
|
3,925 |
|
|
Amortization of actuarial loss |
|
|
1,798 |
|
|
|
2,308 |
|
|
|
3,051 |
|
|
Expected return on plan assets |
|
|
(1,568 |
) |
|
|
(1,594 |
) |
|
|
(1,559 |
) |
|
Net periodic benefit cost (1) |
|
$ |
22,555 |
|
|
$ |
15,874 |
|
|
$ |
10,819 |
|
|
(1) |
The service cost, interest cost and other components of net periodic benefit costs are included in compensation and benefits expense, interest expense, net and other income, net, respectively, on the consolidated statements of income. |
The weighted-average assumptions used in calculating the benefit obligations were as follows:
|
|
|
Year Ended April 30, |
|
|||||||||
|
|
|
2019 |
|
|
2018 |
|
|
2017 |
|
|||
|
Discount rate, beginning of year |
|
|
3.93 |
% |
|
|
3.57 |
% |
|
|
3.18 |
% |
|
Discount rate, end of year |
|
|
3.57 |
% |
|
|
3.93 |
% |
|
|
3.57 |
% |
|
Rate of compensation increase |
|
|
0.00 |
% |
|
|
0.00 |
% |
|
|
0.00 |
% |
|
Expected long-term rates of return on plan assets |
|
|
6.00 |
% |
|
|
6.25 |
% |
|
|
6.50 |
% |
F-27
KORN FERRY AND SUBSIDIARIES
NOTES TO CONSOLIDATED FINANCIAL STATEMENTS
April 30, 2019 (continued)
Benefit payments, which reflect expected future service, as appropriate, are expected to be paid over the next ten years as follows:
|
Year Ending April 30, |
|
Deferred Retirement Plans |
|
|
|
|
|
(in thousands) |
|
|
|
2020 |
|
$ |
10,595 |
|
|
2021 |
|
|
10,507 |
|
|
2022 |
|
|
10,068 |
|
|
2023 |
|
|
9,305 |
|
|
2024 |
|
|
19,150 |
|
|
2025-2029 |
|
|
165,527 |
|
Medical and Life Insurance Plan
In conjunction with the acquisition of Hay Group, the Company inherited a benefit plan which offers medical and life insurance coverage to 126 participants. In fiscal 2018, the Company amended the plan and required any active participants that were not yet eligible for benefits to retire within a short time frame in order to receive any benefits from the plan. As a result of the amendment, participants eligible to the plan declined and the Company reduced the benefit obligation by $4.0 million against other comprehensive income (loss) during fiscal 2018. The medical and life insurance benefit plan is unfunded.
The following table reconciles the benefit obligation for the medical and life insurance plan:
|
|
|
Year End April 30, |
|
|||||
|
|
|
2019 |
|
|
2018 |
|
||
|
|
|
(in thousands) |
|
|||||
|
Change in benefit obligation: |
|
|
|
|
|
|
|
|
|
Benefit obligation, beginning of year |
|
$ |
7,157 |
|
|
$ |
12,147 |
|
|
Plan amendment |
|
|
— |
|
|
|
(4,008 |
) |
|
Service cost |
|
|
— |
|
|
|
91 |
|
|
Interest cost |
|
|
243 |
|
|
|
369 |
|
|
Actuarial loss (gain) |
|
|
520 |
|
|
|
(875 |
) |
|
Benefits paid |
|
|
(610 |
) |
|
|
(567 |
) |
|
Benefit obligation, end of year |
|
$ |
7,310 |
|
|
$ |
7,157 |
|
|
|
|
|
|
|
|
|
|
|
|
Current liability |
|
$ |
643 |
|
|
$ |
668 |
|
|
Non-current liability |
|
|
6,667 |
|
|
|
6,489 |
|
|
Total liability |
|
$ |
7,310 |
|
|
$ |
7,157 |
|
The components of net periodic benefits costs are as follows:
|
|
|
Year Ended April 30, |
|
|||||||||
|
|
|
2019 |
|
|
2018 |
|
|
2017 |
|
|||
|
|
|
(in thousands) |
|
|||||||||
|
Service cost |
|
$ |
— |
|
|
$ |
91 |
|
|
$ |
150 |
|
|
Interest cost |
|
|
243 |
|
|
|
369 |
|
|
|
431 |
|
|
Net periodic service credit amortization |
|
|
(308 |
) |
|
|
(308 |
) |
|
|
— |
|
|
Amortization of actuarial gain |
|
|
(14 |
) |
|
|
— |
|
|
|
— |
|
|
Net periodic benefit cost (1) |
|
$ |
(79 |
) |
|
$ |
152 |
|
|
$ |
581 |
|
|
|
(1) |
The service cost, interest cost and the other components of net periodic benefit costs are included in compensation and benefits expense, interest expense, net and other income, net, respectively, on the consolidated statements of income. |
F-28
KORN FERRY AND SUBSIDIARIES
NOTES TO CONSOLIDATED FINANCIAL STATEMENTS
April 30, 2019 (continued)
The weighted-average assumptions used in calculating the medical and life insurance plan were as follows:
|
|
|
Year Ended April 30, |
|
|||||||||
|
|
|
2019 |
|
|
2018 |
|
|
2017 |
|
|||
|
Discount rate, beginning of year |
|
|
3.94 |
% |
|
|
3.75 |
% |
|
|
3.36 |
% |
|
Discount rate, end of year |
|
|
3.67 |
% |
|
|
3.94 |
% |
|
|
3.75 |
% |
|
Healthcare care cost trend rate |
|
|
6.50 |
% |
|
|
7.00 |
% |
|
|
7.00 |
% |
Benefit payments, which reflect expected future service, as appropriate, are expected to be paid over the next ten years as follows:
|
Year Ending April 30, |
|
Medical and Life Insurance |
|
|
|
|
|
(in thousands) |
|
|
|
2020 |
|
$ |
651 |
|
|
2021 |
|
|
646 |
|
|
2022 |
|
|
632 |
|
|
2023 |
|
|
616 |
|
|
2024 |
|
|
597 |
|
|
2025-2029 |
|
|
2,542 |
|
International Retirement Plans
The Company also maintains various retirement plans and other miscellaneous deferred compensation arrangements in 23 foreign jurisdictions. The aggregate of the long-term benefit obligation accrued at April 30, 2019 and 2018 is $14.7 million for 2,777 participants and $13.7 million for 2,423 participants, respectively. The Company’s contribution to these plans was $13.3 million and $11.8 million in fiscal 2019 and 2018, respectively.
Executive Capital Accumulation Plan
The Company’s ECAP is intended to provide certain employees an opportunity to defer salary and/or bonus on a pre-tax basis. In addition, the Company, as part of its compensation philosophy, makes discretionary contributions into the ECAP and such contributions may be granted to key employees annually based on the employee’s performance. Certain key management may also receive Company ECAP contributions upon commencement of employment. The Company amortizes these contributions on a straight-line basis over the service period, generally a four to five year period. Participants have the ability to allocate their deferrals among a number of investment options and may receive their benefits at termination, retirement or ‘in service’ either in a lump sum or in quarterly installments over one to 15 years. The ECAP amounts that are expected to be paid to employees over the next 12 months are classified as a current liability included in compensation and benefits payable on the accompanying consolidated balance sheets.
The Company issued ECAP awards during fiscal 2019, 2018 and 2017 of $8.5 million, $6.2 million and $6.2 million, respectively.
The ECAP is accounted for whereby the changes in the fair value of the vested amounts owed to the participants are adjusted with a corresponding charge (or credit) to compensation and benefits costs. During fiscal 2019, 2018, and 2017, the deferred compensation liability increased; therefore, the Company recognized compensation expense of $8.7 million, $11.1 million, and $10.6 million, respectively. Offsetting the increases in compensation and benefits liability was an increase in the fair value of marketable securities classified as trading (held in trust to satisfy obligations of the ECAP liabilities) of $8.1 million, $10.3 million, and $10.8 million in fiscal 2019, 2018, and 2017, respectively, recorded in other income, net on the consolidated statements of income.
F-29
KORN FERRY AND SUBSIDIARIES
NOTES TO CONSOLIDATED FINANCIAL STATEMENTS
April 30, 2019 (continued)
Changes in the ECAP liability were as follows:
|
|
|
Year Ended April 30, |
|
|||||
|
|
|
2019 |
|
|
2018 |
|
||
|
|
|
(in thousands) |
|
|||||
|
Balance, beginning of year |
|
$ |
128,430 |
|
|
$ |
111,584 |
|
|
Employee contributions |
|
|
4,852 |
|
|
|
5,036 |
|
|
Amortization of employer contributions |
|
|
9,573 |
|
|
|
12,175 |
|
|
Gain on investment |
|
|
8,697 |
|
|
|
11,095 |
|
|
Employee distributions |
|
|
(20,891 |
) |
|
|
(11,923 |
) |
|
Exchange rate fluctuations |
|
|
(500 |
) |
|
|
463 |
|
|
Balance, end of year |
|
|
130,161 |
|
|
|
128,430 |
|
|
Less: current portion |
|
|
(8,844 |
) |
|
|
(14,827 |
) |
|
Non-current portion |
|
$ |
121,317 |
|
|
$ |
113,603 |
|
As of April 30, 2019 and 2018, the unamortized portion of the Company contributions to the ECAP was $16.8 million and $19.2 million, respectively.
The Company has a defined contribution plan (“401(k) plan”) for eligible employees. Participants may contribute up to 50% of their base compensation as defined in the plan agreement. In addition, the Company has the option to make matching contributions. The Company intends to make matching contributions related to fiscal 2019 in fiscal 2020. The Company made a $2.7 million matching contribution in fiscal 2019 related to contributions made by employees in fiscal 2018 and a $2.3 million matching contribution in fiscal 2018 related to contributions made by employees in fiscal 2017.
Company Owned Life Insurance
The Company purchased COLI contracts insuring the lives of certain employees eligible to participate in the deferred compensation and pension plans as a means of funding benefits under such plans. The gross CSV of these contracts of $219.2 million and $186.8 million as of April 30, 2019 and 2018, respectively, is offset by outstanding policy loans of $93.2 million and $66.7 million in the accompanying consolidated balance sheets as of April 30, 2019 and 2018, respectively. Total death benefits payable, net of loans under COLI contracts, were $223.6 million and $226.0 million at April 30, 2019 and 2018, respectively. Management intends to use the future death benefits from these insurance contracts to fund the deferred compensation and pension arrangements; however, there may not be a direct correlation between the timing of the future cash receipts and disbursements under these arrangements. The CSV value of the underlying COLI investments increased by $6.2 million, $7.8 million and $4.9 million during fiscal 2019, 2018 and 2017, respectively, recorded as a decrease in compensation and benefits expense. In addition, certain policies are held in trusts to provide additional benefit security for the deferred compensation and pension plans. As of April 30, 2019, COLI contracts with a net CSV of $115.7 million and death benefits, net of loans, of $178.7 million were held in trust for these purposes.
7. Fee Revenue
Substantially all fee revenue is derived from fees for professional services related to executive and professional recruitment performed on a retained basis, recruitment process outsourcing, talent and organizational advisory services and the sale of products, standalone or as part of a solution. The Company adopted ASC 606 in its fiscal year beginning May 1, 2018 using the modified retrospective transition method applied to those contracts still outstanding and not completed as of May 1, 2018. The impact of the adoption of ASC 606 to the balance sheet was immaterial.
Contract Balances
A contract asset (unbilled receivables) is recorded when the Company transfers control of products or services before there is an unconditional right to payment. A contract liability (deferred revenue) is recorded when cash is received in advance of performance of the obligation. Deferred revenue represents the future performance obligations to transfer control of products or services for which we have already received consideration. Deferred revenue is presented in other accrued liabilities on the consolidated balance sheet.
F-30
KORN FERRY AND SUBSIDIARIES
NOTES TO CONSOLIDATED FINANCIAL STATEMENTS
April 30, 2019 (continued)
The following table outlines our contract asset and liability balances as of April 30, 2019 and May 1, 2018:
|
|
|
April 30, 2019 |
|
|
May 1, 2018 |
|
||
|
|
|
(in thousands) |
|
|||||
|
Contract assets (unbilled receivables) |
|
$ |
60,595 |
|
|
$ |
65,164 |
|
|
Contract liabilities (deferred revenue) |
|
$ |
112,999 |
|
|
$ |
114,695 |
|
During the year ended April 30, 2019, we recognized revenue of $97.0 million that was included in the contract liabilities balance at the beginning of the period.
Performance Obligations
The Company has elected to apply the practical expedient to exclude the value of unsatisfied performance obligations for contracts with a duration of one year or less, which applies to all executive search and professional search fee revenue. As of April 30, 2019, the aggregate transaction price allocated to the performance obligations that are unsatisfied for contracts with an expected duration of greater than one year at inception was $539.5 million. Of the $539.5 million of remaining performance obligations, we expect to recognize approximately $307.7 million as fee revenue in fiscal 2020, $132.2 million in fiscal 2021, $77.4 million in fiscal 2022 and the remaining $22.2 million in fiscal 2023 and thereafter. However, this amount should not be considered an indication of the Company’s future revenue as contracts with an initial term of one year or less are not included. Further, our contract terms and conditions allow for clients to increase or decrease the scope of services and such changes do not increase or decrease a performance obligation until the Company has an enforceable right to payment.
Disaggregation of Revenue
The Company disaggregates its revenue by line of business and further by region for Executive Search. This information is presented in Note 11—Segments.
The following table provides further disaggregation of fee revenue by industry:
|
|
|
Year Ended April 30, |
|
|||||||||||||||||||||
|
|
|
2019 |
|
|
2018 |
|
|
2017 |
|
|||||||||||||||
|
|
|
Dollars |
|
|
% |
|
|
Dollars |
|
|
% |
|
|
Dollars |
|
|
% |
|
||||||
|
|
|
(dollars in thousands) |
|
|||||||||||||||||||||
|
Industrial |
|
$ |
561,029 |
|
|
|
29.1 |
% |
|
$ |
530,547 |
|
|
|
30.0 |
% |
|
$ |
459,732 |
|
|
|
29.4 |
% |
|
Financial Services |
|
|
349,968 |
|
|
|
18.2 |
|
|
|
305,047 |
|
|
|
17.3 |
|
|
|
257,671 |
|
|
|
16.4 |
|
|
Life Sciences/Healthcare |
|
|
323,091 |
|
|
|
16.8 |
|
|
|
294,999 |
|
|
|
16.7 |
|
|
|
273,493 |
|
|
|
17.5 |
|
|
Consumer Goods |
|
|
297,676 |
|
|
|
15.5 |
|
|
|
276,979 |
|
|
|
15.7 |
|
|
|
263,671 |
|
|
|
16.8 |
|
|
Technology |
|
|
260,918 |
|
|
|
13.5 |
|
|
|
226,142 |
|
|
|
12.8 |
|
|
|
198,867 |
|
|
|
12.7 |
|
|
Education/Non-Profit |
|
|
122,524 |
|
|
|
6.3 |
|
|
|
120,809 |
|
|
|
6.8 |
|
|
|
99,978 |
|
|
|
6.4 |
|
|
General |
|
|
10,827 |
|
|
|
0.6 |
|
|
|
12,694 |
|
|
|
0.7 |
|
|
|
12,109 |
|
|
|
0.8 |
|
|
Fee Revenue |
|
$ |
1,926,033 |
|
|
|
100.0 |
% |
|
$ |
1,767,217 |
|
|
|
100.0 |
% |
|
$ |
1,565,521 |
|
|
|
100.0 |
% |
8. Income Taxes
Income from continuing operations before provision for income taxes and equity in earnings of unconsolidated subsidiaries was as follows:
|
|
|
Year Ended April 30, |
|
|||||||||
|
|
|
2019 |
|
|
2018 |
|
|
2017 |
|
|||
|
|
|
(in thousands) |
|
|||||||||
|
Domestic |
|
$ |
(22,350 |
) |
|
$ |
46,867 |
|
|
$ |
5,539 |
|
|
Foreign |
|
|
156,379 |
|
|
|
158,866 |
|
|
|
110,470 |
|
|
Income before provision for income taxes and equity in earnings of unconsolidated subsidiaries |
|
$ |
134,029 |
|
|
$ |
205,733 |
|
|
$ |
116,009 |
|
F-31
KORN FERRY AND SUBSIDIARIES
NOTES TO CONSOLIDATED FINANCIAL STATEMENTS
April 30, 2019 (continued)
The provision (benefit) for domestic and foreign income taxes was as follows:
|
|
|
Year Ended April 30, |
|
|||||||||
|
|
|
2019 |
|
|
2018 |
|
|
2017 |
|
|||
|
|
|
(in thousands) |
|
|||||||||
|
Current income taxes: |
|
|
|
|
|
|
|
|
|
|
|
|
|
Federal |
|
$ |
6,152 |
|
|
$ |
29,400 |
|
|
$ |
(2,026 |
) |
|
State |
|
|
9,097 |
|
|
|
2,863 |
|
|
|
1,207 |
|
|
Foreign |
|
|
42,091 |
|
|
|
44,434 |
|
|
|
23,334 |
|
|
Current provision for income taxes |
|
|
57,340 |
|
|
|
76,697 |
|
|
|
22,515 |
|
|
Deferred income taxes: |
|
|
|
|
|
|
|
|
|
|
|
|
|
Federal |
|
|
(16,211 |
) |
|
|
(3,530 |
) |
|
|
3,341 |
|
|
State |
|
|
(7,682 |
) |
|
|
(317 |
) |
|
|
341 |
|
|
Foreign |
|
|
(3,903 |
) |
|
|
(2,717 |
) |
|
|
2,907 |
|
|
Deferred (benefit) provision for income taxes |
|
|
(27,796 |
) |
|
|
(6,564 |
) |
|
|
6,589 |
|
|
Total provision for income taxes |
|
$ |
29,544 |
|
|
$ |
70,133 |
|
|
$ |
29,104 |
|
The reconciliation of the statutory federal income tax rate to the effective consolidated tax rate is as follows:
|
|
|
Year Ended April 30, |
|
|||||||||
|
|
|
2019 |
|
|
2018 |
|
|
2017 |
|
|||
|
U.S. federal statutory income tax rate |
|
|
21.0 |
% |
|
|
30.4 |
% |
|
|
35.0 |
% |
|
Foreign tax rates differential |
|
|
5.0 |
|
|
|
(2.3 |
) |
|
|
(9.1 |
) |
|
Transition tax |
|
|
— |
|
|
|
9.0 |
|
|
|
— |
|
|
Deferred tax remeasurement |
|
|
— |
|
|
|
(2.4 |
) |
|
|
— |
|
|
Non-deductible officers compensation |
|
|
1.1 |
|
|
|
— |
|
|
|
— |
|
|
Excess tax benefit on stock-based compensation |
|
|
(3.1 |
) |
|
|
— |
|
|
|
— |
|
|
Change in valuation allowance |
|
|
(2.0 |
) |
|
|
(2.3 |
) |
|
|
(3.1 |
) |
|
Other |
|
|
— |
|
|
|
1.7 |
|
|
|
2.3 |
|
|
Effective income tax rate |
|
|
22.0 |
% |
|
|
34.1 |
% |
|
|
25.1 |
% |
The 21% corporate income tax rate enacted as part of the 2017 Tax Act went fully into effect in our fiscal 2019. In fiscal 2018, the Company was subject to a federal blended rate of 30.4% (35% in the eight months prior to enactment and 21% in the four months after). Our lower effective tax rate in fiscal 2019 is partially attributable to the reduced U.S. federal income tax rate as well as a tax benefit recorded in connection with stock-based compensation. In the last three fiscal years, the Company recorded an income tax benefit from the reversal of valuation allowances previously recorded against deferred tax assets, including net operating losses, of certain foreign subsidiaries that have returned to profitability and are now more-likely-than-not to realize those deferred tax assets.
In fiscal 2018, the Company recorded a provisional tax charge of $18.4 million for the one-time tax on accumulated foreign earnings (the “Transition Tax”) and a provisional tax benefit of $5.9 million from the remeasurement of our U.S. federal deferred tax assets and liabilities at the rate at which we expected these deferred tax balances to be realized. In accordance with Staff Accounting Bulletin No. 118 (“SAB 118”), we finalized our computation of the Transition Tax and remeasurement of deferred tax balances in fiscal 2019 and determined that the provisional estimates recorded in the fiscal 2018 do not require adjustment. Although the SAB 118 measurement period has closed, and the Company did not make any adjustments to its provisional estimates recorded in prior periods, further technical guidance on a broad range of topics related to the Tax Act is expected. When applicable, we will recognize the effects of such guidance in the period in which it is issued.
The Tax Act also introduced a tax on Global Intangible Low-Taxed Income (“GILTI”) which first became effective in fiscal 2019. The Company has elected to treat taxes due on future U.S. inclusions in taxable income related to GILTI as an expense when incurred (the “period cost method”) as opposed to factoring such amounts in the Company’s measurement of its deferred taxes (the “deferred method”).
F-32
KORN FERRY AND SUBSIDIARIES
NOTES TO CONSOLIDATED FINANCIAL STATEMENTS
April 30, 2019 (continued)
Components of deferred tax assets and liabilities were as follows:
|
|
|
April 30, |
|
|||||
|
|
|
2019 |
|
|
2018 |
|
||
|
|
|
(in thousands) |
|
|||||
|
Deferred tax assets: |
|
|
|
|
|
|
|
|
|
Deferred compensation |
|
$ |
75,521 |
|
|
$ |
67,852 |
|
|
Loss carryforwards |
|
|
22,467 |
|
|
|
22,297 |
|
|
Reserves and accruals |
|
|
12,954 |
|
|
|
13,945 |
|
|
Deferred rent |
|
|
7,652 |
|
|
|
6,827 |
|
|
Deferred revenue |
|
|
1,090 |
|
|
|
1,793 |
|
|
Allowance for doubtful accounts |
|
|
3,217 |
|
|
|
2,296 |
|
|
Other |
|
|
— |
|
|
|
982 |
|
|
Gross deferred tax assets |
|
|
122,901 |
|
|
|
115,992 |
|
|
Deferred tax liabilities: |
|
|
|
|
|
|
|
|
|
Intangibles |
|
|
(28,958 |
) |
|
|
(57,046 |
) |
|
Property and equipment |
|
|
(15,883 |
) |
|
|
(5,000 |
) |
|
Prepaid expenses |
|
|
(20,152 |
) |
|
|
(19,123 |
) |
|
Other |
|
|
(1,759 |
) |
|
|
(2,726 |
) |
|
Gross deferred tax liabilities |
|
|
(66,752 |
) |
|
|
(83,895 |
) |
|
Valuation allowances |
|
|
(14,032 |
) |
|
|
(15,682 |
) |
|
Net deferred tax asset |
|
$ |
42,117 |
|
|
$ |
16,415 |
|
Deferred tax assets are reduced by a valuation allowance if it is more-likely-than-not that some portion or all of the deferred tax assets will not be realized. Management believes uncertainty exists regarding the realizability of certain operating losses and has, therefore, established a valuation allowance for this portion of the deferred tax asset. Realization of the deferred tax asset is dependent on the Company generating sufficient taxable income of the appropriate nature in future years. Although realization is not assured, management believes that it is more likely than-not that the net deferred tax assets will be realized. Deferred tax assets and deferred tax liabilities are presented net on the consolidated balance sheets by tax jurisdiction.
As of April 30, 2019, the Company had U.S. federal net operating loss carryforwards of $2.9 million, which the Company anticipates will be fully utilized by fiscal 2028. The Company has state net operating loss carryforwards of $39.8 million, which, if unutilized, will begin to expire in fiscal 2020. The Company also has foreign net operating loss carryforwards of $79.9 million, which, if unutilized, will begin to expire in fiscal 2020.
We continue to consider approximately $555.4 million of undistributed earnings of our foreign subsidiaries to be indefinitely reinvested, and, accordingly, have provided no taxes on such earnings other than the Transition Tax. While we do not anticipate a need to repatriate funds to the U.S. to satisfy domestic liquidity needs, we review our cash positions regularly and, to the extent we determine that all or a portion of our foreign earnings are not indefinitely reinvested, we provide additional taxes, if applicable, including foreign withholding taxes and U.S. state income taxes.
The Company and its subsidiaries file federal and state income tax returns in the U.S. as well as in foreign jurisdictions. These income tax returns are subject to audit by the Internal Revenue Service (the “IRS”) and various state and foreign tax authorities. The IRS has concluded its audit of our fiscal year 2016 federal tax return. The State of New York and the City of New York are currently auditing the Company’s state income tax returns for various fiscal years. Outside the U.S., income tax returns of the Company’s subsidiaries are under audit in India. The Company’s income tax returns are not otherwise under examination in any material jurisdictions. The statute of limitations varies by jurisdiction in which the Company operates. With few exceptions, however, the Company’s tax returns for years prior to fiscal 2013 are no longer open to examination by tax authorities (including U.S. federal, state and foreign).
F-33
KORN FERRY AND SUBSIDIARIES
NOTES TO CONSOLIDATED FINANCIAL STATEMENTS
April 30, 2019 (continued)
Unrecognized tax benefits are the differences between the amount of benefits of tax positions taken, or expected to be taken, on a tax return and the amount of benefits recognized for financial reporting purposes. As of April 30, 2019, the Company had a liability of $7.8 million for unrecognized tax benefits. A reconciliation of the beginning and ending balances of the unrecognized tax benefits is as follows:
|
|
|
Year Ended April 30, |
|
|||||||||
|
|
|
2019 |
|
|
2018 |
|
|
2017 |
|
|||
|
|
|
(in thousands) |
|
|||||||||
|
Unrecognized tax benefits, beginning of year |
|
$ |
3,674 |
|
|
$ |
2,478 |
|
|
$ |
2,095 |
|
|
Settlement with tax authority |
|
|
(1,771 |
) |
|
|
(708 |
) |
|
|
— |
|
|
Additions based on tax positions related to the current year |
|
|
1,775 |
|
|
|
1,116 |
|
|
|
383 |
|
|
Additions based on tax positions related to prior years |
|
|
4,116 |
|
|
|
788 |
|
|
|
— |
|
|
Unrecognized tax benefits, end of year |
|
$ |
7,794 |
|
|
$ |
3,674 |
|
|
$ |
2,478 |
|
The full amount of unrecognized tax benefits would impact the effective tax rate if recognized. In the next 12 months, it is reasonably possible that the Company’s unrecognized tax benefits could change due to the resolution of certain tax matters either because the tax positions are sustained on audit or the Company agrees to their disallowance. These resolutions could reduce the Company’s liability for unrecognized tax benefits by approximately $3.7 million. The Company does not expect a change in the amount of unrecognized tax benefits to have a material financial statement impact.
The Company classifies interest and penalties related to unrecognized tax benefits as a component of the provision for income taxes. The Company had accruals of $0.4 million and $0.3 million for interest related to unrecognized tax benefits as of April 30, 2019 and 2018, respectively. The Company had no accrual for penalties related to unrecognized tax benefits as of April 30, 2019 and 2018. The Company recognized interest expense of $0.1 million, $0.3 million and $0.1 million during the years ended April 30, 2019, 2018 and 2017, respectively.
9. Property and Equipment, Net
Property and equipment include the following:
|
|
|
April 30, |
|
|||||
|
|
|
2019 |
|
|
2018 |
|
||
|
|
|
(in thousands) |
|
|||||
|
Computer equipment and software (1) |
|
$ |
220,894 |
|
|
$ |
191,437 |
|
|
Leasehold improvements |
|
|
84,368 |
|
|
|
82,467 |
|
|
Furniture and fixtures |
|
|
42,318 |
|
|
|
42,889 |
|
|
Automobiles |
|
|
1,022 |
|
|
|
1,305 |
|
|
|
|
|
348,602 |
|
|
|
318,098 |
|
|
Less: accumulated depreciation and amortization |
|
|
(217,097 |
) |
|
|
(198,197 |
) |
|
Property and equipment, net |
|
$ |
131,505 |
|
|
$ |
119,901 |
|
|
(1) |
Depreciation expense for capitalized software was $14.6 million, $12.8 million and $12.6 million during fiscal 2019, 2018 and 2017, respectively. The net book value of the Company’s computer software costs included in property and equipment, net was $65.8 million and $46.4 million as of April 30, 2019 and 2018, respectively. |
Depreciation expense for property and equipment was $33.0 million, $33.8 million and $31.9 million during fiscal 2019, 2018 and 2017, respectively.
10. Long-Term Debt
On December 19, 2018, the Company entered into an Amended and Restated Credit Agreement (the “Credit Agreement”) with a syndicate of banks and Wells Fargo Bank, National Association as administrative agent to among other things, provide for enhanced financial flexibility. The Credit Agreement provides for, among other things: (a) a $650.0 million five-year senior secured revolving credit facility (the “Revolver”) and (b) certain customary affirmative and negative covenants, including a maximum consolidated total leverage ratio (as defined below) and a minimum interest coverage ratio. The Credit Agreement permits the payment of dividends to stockholders and Company share repurchases so long as pro forma leverage ratio is no greater than 3.25 to 1.00, and the pro forma domestic liquidity is at least $50.0 million. The Company drew down $226.9 million on the Revolver and used the proceeds to pay-off
F-34
KORN FERRY AND SUBSIDIARIES
NOTES TO CONSOLIDATED FINANCIAL STATEMENTS
April 30, 2019 (continued)
the term loan that was outstanding as of December 19, 2018. The payoff of the old credit facility and draw down on the new Revolver are considered a debt modification and therefore, the previously incurred unamortized and current debt issuance costs will be amortized over the life of the new issuance. The principal balance of the revolver is due on the date of its termination. The Revolver matures on December 19, 2023 and any unpaid principal balance is payable on this date. The Revolver may also be prepaid and terminated early by the Company at any time without premium or penalty (subject to customary LIBOR breakage fees).
At the Company’s option, loans issued under the Credit Agreement will bear interest at either LIBOR or an alternate base rate, in each case plus the applicable interest rate margin. The interest rate applicable to loans outstanding under the Credit Agreement may fluctuate between LIBOR plus 1.25% per annum to LIBOR plus 2.00% per annum, in the case of LIBOR borrowings (or between the alternate base rate plus 0.25% per annum and the alternate base rate plus 1.00% per annum, in the alternative), based upon the Company’s total funded debt to Adjusted EBITDA ratio (as set forth in the Credit Agreement, the “consolidated leverage ratio”) at such time. In addition, the Company will be required to pay to the lenders a quarterly commitment fee ranging from 0.20% to 0.35% per annum on the average daily unused amount of the Revolver, based upon the Company’s consolidated leverage ratio at such time, and fees relating to the issuance of letters of credit. During fiscal 2019 the average interest rate on our long-term debt arrangements was 3.50%. During fiscal 2018 the average interest rate on our previous term loan was 2.60%.
As of April 30, 2019, $226.9 million was outstanding under the Revolver compared to $238.9 million as of April 30, 2018, under the previous term loan. The unamortized debt issuance costs associated with the long-term debt were $4.0 million and $2.7 million as of April 30, 2019 and April 30, 2018, respectively. The fair value of the Company’s Revolver is based on borrowing rates currently required of loans with similar terms, maturity and credit risk. The carrying amount of the Revolver approximates fair value because the base interest rate charged varies with market conditions and the credit spread is commensurate with current market spreads for issuers of similar risk. The fair value of the Revolver is classified as a Level 2 liability in the fair value hierarchy. As of April 30, 2019, the Company was in compliance with its debt covenants.
The Company had a total of $420.2 million available under the Revolver after the Company drew down $226.9 million and after $2.9 million of standby letters of credit were issued as of April 30, 2019. As of April 30, 2018, the Company had no borrowings under its previous revolver. The Company had a total of $122.1 million available under the previous revolver after $2.9 million of standby letters of credit were issued as of April 30, 2018. The Company had a total of $8.5 million and $7.4 million of standby letters with other financial institutions as of April 30, 2019 and 2018, respectively. The standby letters of credits were generally issued as a result of entering into office premise leases.
The Company has outstanding borrowings against the CSV of COLI contracts of $93.2 million and $66.7 million at April 30, 2019 and 2018, respectively. CSV reflected in the accompanying consolidated balance sheets is net of the outstanding borrowings, which are secured by the CSV of the life insurance policies. Principal payments are not scheduled and interest is payable at least annually at various fixed and variable rates ranging from 4.76% to 8.00%.
11. Segments
The Company currently operates through three global segments: Executive Search, Advisory and RPO & Professional Search. The Executive Search segment focuses on recruiting board level, chief executive and other senior executive and general management positions, in addition to research-based interviewing and onboarding solutions, for clients predominantly in the consumer goods, financial services, industrial, life sciences/healthcare and technology industries. Advisory assists clients to synchronize strategy and talent by addressing four fundamental needs: Organizational Strategy, Assessment and Succession, Leadership Development and Rewards and Benefits, all underpinned by a comprehensive array of world-leading IP, products and tools. RPO & Professional Search is a global industry leader in high-impact talent acquisition solutions. Its portfolio of services includes global and regional RPO, project recruitment, individual professional search and consulting. The Executive Search segment is managed by geographic regional leaders and Advisory and RPO & Professional Search worldwide operations are managed by their Chief Executive Officers. The Executive Search geographic regional leaders and the Chief Executive Officers of Advisory and RPO & Professional Search report directly to the Chief Executive Officer of the Company. The Company also operates a Corporate segment to record global expenses of the Company.
F-35
KORN FERRY AND SUBSIDIARIES
NOTES TO CONSOLIDATED FINANCIAL STATEMENTS
April 30, 2019 (continued)
The Company evaluates performance and allocates resources based on the Company’s chief operating decision maker’s (“CODM”) review of (1) fee revenue and (2) adjusted earnings before interest, taxes, depreciation and amortization (“Adjusted EBITDA”). To the extent that such charges occur, Adjusted EBITDA excludes restructuring charges, integration/acquisition costs, certain separation costs and certain non-cash charges (goodwill, intangible asset and other than temporary impairment). The accounting policies for the reportable segments are the same as those described in the summary of significant accounting policies, except the items described above are excluded from EBITDA to arrive at Adjusted EBITDA. For fiscal 2017, Adjusted EBITDA included deferred revenue adjustment related to the Hay Group acquisition, reflecting revenue that Advisory would have realized if not for business combination accounting that requires a company to record the acquisition balance sheet at fair value and write-off deferred revenue where no future services are required to be performed to earn that revenue. For fiscal 2019 and 2018, management no longer had adjusted fee revenue. The accounting policies for the reportable segments are the same as those described in the summary of significant accounting policies, except the items described above are excluded from EBITDA to arrive at Adjusted EBITDA.
Financial highlights by operating segment are as follows:
|
|
|
Year Ended April 30, 2019 |
|
|||||||||||||||||||||||||||||||||
|
|
|
Executive Search |
|
|
|
|
|
|
|
|
|
|
|
|
|
|
|
|
|
|||||||||||||||||
|
|
|
North America |
|
|
EMEA |
|
|
Asia Pacific |
|
|
Latin America |
|
|
Subtotal |
|
|
Advisory |
|
|
RPO & Professional Search |
|
|
Corporate |
|
|
Consolidated |
|
|||||||||
|
|
|
(in thousands) |
|
|||||||||||||||||||||||||||||||||
|
Fee revenue |
|
$ |
455,826 |
|
|
$ |
182,829 |
|
|
$ |
104,291 |
|
|
$ |
31,896 |
|
|
$ |
774,842 |
|
|
$ |
821,048 |
|
|
$ |
330,143 |
|
|
$ |
— |
|
|
$ |
1,926,033 |
|
|
Total revenue |
|
$ |
469,743 |
|
|
$ |
186,131 |
|
|
$ |
105,543 |
|
|
$ |
31,960 |
|
|
$ |
793,377 |
|
|
$ |
838,620 |
|
|
$ |
341,865 |
|
|
$ |
— |
|
|
$ |
1,973,862 |
|
|
|
|
|
|
|
|
|
|
|
|
|
|
|
|
|
|
|
|
|
|
|
|
|
|
|
|
|
|
|
|
|
|
|
|
|
|
|
|
Net income attributable to Korn Ferry |
|
|
|
|
|
|
|
|
|
|
|
|
|
|
|
|
|
|
|
|
|
|
|
|
|
|
|
|
|
|
|
|
|
$ |
102,651 |
|
|
Net income attributable to noncontrolling interest |
|
|
|
|
|
|
|
|
|
|
|
|
|
|
|
|
|
|
|
|
|
|
|
|
|
|
|
|
|
|
|
|
|
|
2,145 |
|
|
Other income, net |
|
|
|
|
|
|
|
|
|
|
|
|
|
|
|
|
|
|
|
|
|
|
|
|
|
|
|
|
|
|
|
|
|
|
(10,094 |
) |
|
Interest expense, net |
|
|
|
|
|
|
|
|
|
|
|
|
|
|
|
|
|
|
|
|
|
|
|
|
|
|
|
|
|
|
|
|
|
|
16,891 |
|
|
Equity in earnings of unconsolidated subsidiaries, net |
|
|
|
|
|
|
|
|
|
|
|
|
|
|
|
|
|
|
|
|
|
|
|
|
|
|
|
|
|
|
|
|
|
|
(311 |
) |
|
Income tax provision |
|
|
|
|
|
|
|
|
|
|
|
|
|
|
|
|
|
|
|
|
|
|
|
|
|
|
|
|
|
|
|
|
|
|
29,544 |
|
|
Operating income (loss) |
|
$ |
120,754 |
|
|
$ |
29,974 |
|
|
$ |
24,364 |
|
|
$ |
3,998 |
|
|
$ |
179,090 |
|
|
$ |
5,617 |
|
|
$ |
50,884 |
|
|
$ |
(94,765 |
) |
|
$ |
140,826 |
|
|
Depreciation and amortization |
|
|
3,890 |
|
|
|
1,254 |
|
|
|
1,428 |
|
|
|
410 |
|
|
|
6,982 |
|
|
|
29,057 |
|
|
|
3,255 |
|
|
|
7,195 |
|
|
|
46,489 |
|
|
Other income (loss), net |
|
|
6,388 |
|
|
|
432 |
|
|
|
281 |
|
|
|
322 |
|
|
|
7,423 |
|
|
|
3,198 |
|
|
|
268 |
|
|
|
(795 |
) |
|
|
10,094 |
|
|
Equity in earnings of unconsolidated subsidiaries, net |
|
|
311 |
|
|
|
— |
|
|
|
— |
|
|
|
— |
|
|
|
311 |
|
|
|
— |
|
|
|
— |
|
|
|
— |
|
|
|
311 |
|
|
EBITDA |
|
|
131,343 |
|
|
|
31,660 |
|
|
|
26,073 |
|
|
|
4,730 |
|
|
|
193,806 |
|
|
|
37,872 |
|
|
|
54,407 |
|
|
|
(88,365 |
) |
|
|
197,720 |
|
|
Integration/acquisition costs |
|
|
— |
|
|
|
— |
|
|
|
— |
|
|
|
— |
|
|
|
— |
|
|
|
6,559 |
|
|
|
— |
|
|
|
187 |
|
|
|
6,746 |
|
|
Tradename write-offs |
|
|
— |
|
|
|
— |
|
|
|
— |
|
|
|
— |
|
|
|
— |
|
|
|
106,555 |
|
|
|
— |
|
|
|
— |
|
|
|
106,555 |
|
|
Adjusted EBITDA |
|
$ |
131,343 |
|
|
$ |
31,660 |
|
|
$ |
26,073 |
|
|
$ |
4,730 |
|
|
$ |
193,806 |
|
|
$ |
150,986 |
|
|
$ |
54,407 |
|
|
$ |
(88,178 |
) |
|
$ |
311,021 |
|
|
|
|
|
|
|
|
|
|
|
|
|
|
|
|
|
|
|
|
|
|
|
|
|
|
|
|
|
|
|
|
|
|
|
|
|
|
|
|
Identifiable assets (1) |
|
$ |
427,089 |
|
|
$ |
171,120 |
|
|
$ |
116,006 |
|
|
$ |
24,600 |
|
|
$ |
738,815 |
|
|
$ |
1,045,432 |
|
|
$ |
166,492 |
|
|
$ |
384,113 |
|
|
$ |
2,334,852 |
|
|
Long-lived assets (1) |
|
$ |
19,864 |
|
|
$ |
9,266 |
|
|
$ |
9,255 |
|
|
$ |
2,711 |
|
|
$ |
41,096 |
|
|
$ |
46,689 |
|
|
$ |
8,980 |
|
|
$ |
34,740 |
|
|
$ |
131,505 |
|
|
Goodwill (1) |
|
$ |
46,571 |
|
|
$ |
45,480 |
|
|
$ |
972 |
|
|
$ |
— |
|
|
$ |
93,023 |
|
|
$ |
457,361 |
|
|
$ |
27,914 |
|
|
$ |
— |
|
|
$ |
578,298 |
|
|
(1) |
As of the end of the fiscal year. |
F-36
KORN FERRY AND SUBSIDIARIES
NOTES TO CONSOLIDATED FINANCIAL STATEMENTS
April 30, 2019 (continued)
|
|
|
Year Ended April 30, 2018 |
|
|||||||||||||||||||||||||||||||||
|
|
|
Executive Search |
|
|
|
|
|
|
|
|
|
|
|
|
|
|
|
|
|
|||||||||||||||||
|
|
|
North America |
|
|
EMEA |
|
|
Asia Pacific |
|
|
Latin America |
|
|
Subtotal |
|
|
Advisory |
|
|
RPO & Professional Search |
|
|
Corporate |
|
|
Consolidated |
|
|||||||||
|
|
|
(in thousands) |
|
|||||||||||||||||||||||||||||||||
|
Fee revenue |
|
$ |
408,098 |
|
|
$ |
173,725 |
|
|
$ |
96,595 |
|
|
$ |
30,624 |
|
|
$ |
709,042 |
|
|
$ |
785,013 |
|
|
$ |
273,162 |
|
|
$ |
— |
|
|
$ |
1,767,217 |
|
|
Total revenue |
|
$ |
421,260 |
|
|
$ |
177,234 |
|
|
$ |
98,062 |
|
|
$ |
30,717 |
|
|
$ |
727,273 |
|
|
$ |
801,005 |
|
|
$ |
291,241 |
|
|
$ |
— |
|
|
$ |
1,819,519 |
|
|
|
|
|
|
|
|
|
|
|
|
|
|
|
|
|
|
|
|
|
|
|
|
|
|
|
|
|
|
|
|
|
|
|
|
|
|
|
|
Net income attributable to Korn Ferry |
|
|
|
|
|
|
|
|
|
|
|
|
|
|
|
|
|
|
|
|
|
|
|
|
|
|
|
|
|
|
|
|
|
$ |
133,779 |
|
|
Net income attributable to noncontrolling interest |
|
|
|
|
|
|
|
|
|
|
|
|
|
|
|
|
|
|
|
|
|
|
|
|
|
|
|
|
|
|
|
|
|
|
2,118 |
|
|
Other income, net |
|
|
|
|
|
|
|
|
|
|
|
|
|
|
|
|
|
|
|
|
|
|
|
|
|
|
|
|
|
|
|
|
|
|
(11,119 |
) |
|
Interest expense, net |
|
|
|
|
|
|
|
|
|
|
|
|
|
|
|
|
|
|
|
|
|
|
|
|
|
|
|
|
|
|
|
|
|
|
13,832 |
|
|
Equity in earnings of unconsolidated subsidiaries, net |
|
|
|
|
|
|
|
|
|
|
|
|
|
|
|
|
|
|
|
|
|
|
|
|
|
|
|
|
|
|
|
|
|
|
(297 |
) |
|
Income tax provision |
|
|
|
|
|
|
|
|
|
|
|
|
|
|
|
|
|
|
|
|
|
|
|
|
|
|
|
|
|
|
|
|
|
|
70,133 |
|
|
Operating income (loss) |
|
$ |
100,397 |
|
|
$ |
26,768 |
|
|
$ |
18,425 |
|
|
$ |
4,022 |
|
|
$ |
149,612 |
|
|
$ |
100,535 |
|
|
$ |
39,396 |
|
|
$ |
(81,097 |
) |
|
$ |
208,446 |
|
|
Depreciation and amortization |
|
|
3,930 |
|
|
|
1,689 |
|
|
|
1,408 |
|
|
|
455 |
|
|
|
7,482 |
|
|
|
31,527 |
|
|
|
3,054 |
|
|
|
6,525 |
|
|
|
48,588 |
|
|
Other income, net |
|
|
845 |
|
|
|
168 |
|
|
|
373 |
|
|
|
181 |
|
|
|
1,567 |
|
|
|
2,501 |
|
|
|
152 |
|
|
|
6,899 |
|
|
|
11,119 |
|
|
Equity in earnings of unconsolidated subsidiaries, net |
|
|
297 |
|
|
|
— |
|
|
|
— |
|
|
|
— |
|
|
|
297 |
|
|
|
— |
|
|
|
— |
|
|
|
— |
|
|
|
297 |
|
|
EBITDA |
|
|
105,469 |
|
|
|
28,625 |
|
|
|
20,206 |
|
|
|
4,658 |
|
|
|
158,958 |
|
|
|
134,563 |
|
|
|
42,602 |
|
|
|
(67,673 |
) |
|
|
268,450 |
|
|
Restructuring charges (recoveries), net |
|
|
— |
|
|
|
— |
|
|
|
313 |
|
|
|
— |
|
|
|
313 |
|
|
|
(241 |
) |
|
|
6 |
|
|
|
— |
|
|
|
78 |
|
|
Integration/acquisition costs |
|
|
— |
|
|
|
— |
|
|
|
— |
|
|
|
— |
|
|
|
— |
|
|
|
9,151 |
|
|
|
— |
|
|
|
279 |
|
|
|
9,430 |
|
|
Adjusted EBITDA |
|
$ |
105,469 |
|
|
$ |
28,625 |
|
|
$ |
20,519 |
|
|
$ |
4,658 |
|
|
$ |
159,271 |
|
|
$ |
143,473 |
|
|
$ |
42,608 |
|
|
$ |
(67,394 |
) |
|
$ |
277,958 |
|
|
|
|
|
|
|
|
|
|
|
|
|
|
|
|
|
|
|
|
|
|
|
|
|
|
|
|
|
|
|
|
|
|
|
|
|
|
|
|
Identifiable assets (1) |
|
$ |
411,347 |
|
|
$ |
198,815 |
|
|
$ |
98,599 |
|
|
$ |
23,832 |
|
|
$ |
732,593 |
|
|
$ |
1,092,474 |
|
|
$ |
144,160 |
|
|
$ |
318,687 |
|
|
$ |
2,287,914 |
|
|
Long-lived assets (1) |
|
$ |
22,813 |
|
|
$ |
11,018 |
|
|
$ |
10,834 |
|
|
$ |
3,203 |
|
|
$ |
47,868 |
|
|
$ |
42,605 |
|
|
$ |
6,390 |
|
|
$ |
23,038 |
|
|
$ |
119,901 |
|
|
Goodwill (1) |
|
$ |
47,757 |
|
|
$ |
47,501 |
|
|
$ |
972 |
|
|
$ |
— |
|
|
$ |
96,230 |
|
|
$ |
458,169 |
|
|
$ |
29,823 |
|
|
$ |
— |
|
|
$ |
584,222 |
|
|
(1) |
As of the end of the fiscal year. |
F-37
KORN FERRY AND SUBSIDIARIES
NOTES TO CONSOLIDATED FINANCIAL STATEMENTS
April 30, 2019 (continued)
|
|
|
Year Ended April 30, 2017 |
|
|||||||||||||||||||||||||||||||||
|
|
|
Executive Search |
|
|
|
|
|
|
|
|
|
|
|
|
|
|
|
|
|
|||||||||||||||||
|
|
|
North America |
|
|
EMEA |
|
|
Asia Pacific |
|
|
Latin America |
|
|
Subtotal |
|
|
Advisory |
|
|
RPO & Professional Search |
|
|
Corporate |
|
|
Consolidated |
|
|||||||||
|
|
|
(in thousands) |
|
|||||||||||||||||||||||||||||||||
|
Fee revenue |
|
$ |
356,625 |
|
|
$ |
146,506 |
|
|
$ |
80,169 |
|
|
$ |
34,376 |
|
|
$ |
617,676 |
|
|
$ |
724,186 |
|
|
$ |
223,659 |
|
|
$ |
— |
|
|
$ |
1,565,521 |
|
|
Deferred revenue adjustment due to acquisition |
|
|
— |
|
|
|
— |
|
|
|
— |
|
|
|
— |
|
|
|
— |
|
|
|
3,535 |
|
|
|
— |
|
|
|
— |
|
|
|
3,535 |
|
|
Adjusted fee revenue |
|
$ |
356,625 |
|
|
$ |
146,506 |
|
|
$ |
80,169 |
|
|
$ |
34,376 |
|
|
$ |
617,676 |
|
|
$ |
727,721 |
|
|
$ |
223,659 |
|
|
$ |
— |
|
|
$ |
1,569,056 |
|
|
Total revenue |
|
$ |
369,803 |
|
|
$ |
150,113 |
|
|
$ |
81,744 |
|
|
$ |
34,533 |
|
|
$ |
636,193 |
|
|
$ |
741,533 |
|
|
$ |
243,943 |
|
|
$ |
— |
|
|
$ |
1,621,669 |
|
|
|
|
|
|
|
|
|
|
|
|
|
|
|
|
|
|
|
|
|
|
|
|
|
|
|
|
|
|
|
|
|
|
|
|
|
|
|
|
Net income attributable to Korn Ferry |
|
|
|
|
|
|
|
|
|
|
|
|
|
|
|
|
|
|
|
|
|
|
|
|
|
|
|
|
|
|
|
|
|
$ |
84,181 |
|
|
Net income attributable to noncontrolling interest |
|
|
|
|
|
|
|
|
|
|
|
|
|
|
|
|
|
|
|
|
|
|
|
|
|
|
|
|
|
|
|
|
|
|
3,057 |
|
|
Other income, net |
|
|
|
|
|
|
|
|
|
|
|
|
|
|
|
|
|
|
|
|
|
|
|
|
|
|
|
|
|
|
|
|
|
|
(10,328 |
) |
|
Interest expense, net |
|
|
|
|
|
|
|
|
|
|
|
|
|
|
|
|
|
|
|
|
|
|
|
|
|
|
|
|
|
|
|
|
|
|
14,607 |
|
|
Equity in earnings of unconsolidated subsidiaries, net |
|
|
|
|
|
|
|
|
|
|
|
|
|
|
|
|
|
|
|
|
|
|
|
|
|
|
|
|
|
|
|
|
|
|
(333 |
) |
|
Income tax provision |
|
|
|
|
|
|
|
|
|
|
|
|
|
|
|
|
|
|
|
|
|
|
|
|
|
|
|
|
|
|
|
|
|
|
29,104 |
|
|
Operating income (loss) |
|
$ |
81,621 |
|
|
$ |
27,854 |
|
|
$ |
8,580 |
|
|
$ |
6,268 |
|
|
$ |
124,323 |
|
|
$ |
47,429 |
|
|
$ |
29,995 |
|
|
$ |
(81,459 |
) |
|
$ |
120,288 |
|
|
Depreciation and amortization |
|
|
3,812 |
|
|
|
1,030 |
|
|
|
1,060 |
|
|
|
483 |
|
|
|
6,385 |
|
|
|
32,262 |
|
|
|
2,818 |
|
|
|
5,795 |
|
|
|
47,260 |
|
|
Other income (loss), net |
|
|
844 |
|
|
|
(15 |
) |
|
|
300 |
|
|
|
684 |
|
|
|
1,813 |
|
|
|
1,900 |
|
|
|
(91 |
) |
|
|
6,706 |
|
|
|
10,328 |
|
|
Equity in earnings of unconsolidated subsidiaries, net |
|
|
333 |
|
|
|
— |
|
|
|
— |
|
|
|
— |
|
|
|
333 |
|
|
|
— |
|
|
|
— |
|
|
|
— |
|
|
|
333 |
|
|
EBITDA |
|
|
86,610 |
|
|
|
28,869 |
|
|
|
9,940 |
|
|
|
7,435 |
|
|
|
132,854 |
|
|
|
81,591 |
|
|
|
32,722 |
|
|
|
(68,958 |
) |
|
|
178,209 |
|
|
Restructuring charges, net |
|
|
1,719 |
|
|
|
629 |
|
|
|
1,495 |
|
|
|
773 |
|
|
|
4,616 |
|
|
|
29,663 |
|
|
|
101 |
|
|
|
220 |
|
|
|
34,600 |
|
|
Integration/acquisition costs |
|
|
— |
|
|
|
— |
|
|
|
— |
|
|
|
— |
|
|
|
— |
|
|
|
14,440 |
|
|
|
— |
|
|
|
7,939 |
|
|
|
22,379 |
|
|
Deferred revenue adjustment due to acquisition |
|
|
— |
|
|
|
— |
|
|
|
— |
|
|
|
— |
|
|
|
— |
|
|
|
3,535 |
|
|
|
— |
|
|
|
— |
|
|
|
3,535 |
|
|
Separation costs |
|
|
— |
|
|
|
— |
|
|
|
— |
|
|
|
— |
|
|
|
— |
|
|
|
609 |
|
|
|
— |
|
|
|
— |
|
|
|
609 |
|
|
Adjusted EBITDA |
|
$ |
88,329 |
|
|
$ |
29,498 |
|
|
$ |
11,435 |
|
|
$ |
8,208 |
|
|
$ |
137,470 |
|
|
$ |
129,838 |
|
|
$ |
32,823 |
|
|
$ |
(60,799 |
) |
|
$ |
239,332 |
|
|
|
|
|
|
|
|
|
|
|
|
|
|
|
|
|
|
|
|
|
|
|
|
|
|
|
|
|
|
|
|
|
|
|
|
|
|
|
|
Identifiable assets (1) |
|
$ |
340,069 |
|
|
$ |
158,927 |
|
|
$ |
87,845 |
|
|
$ |
26,897 |
|
|
$ |
613,738 |
|
|
$ |
1,057,611 |
|
|
$ |
116,717 |
|
|
$ |
274,832 |
|
|
$ |
2,062,898 |
|
|
Long-lived assets (1) |
|
$ |
23,746 |
|
|
$ |
11,089 |
|
|
$ |
8,371 |
|
|
$ |
3,262 |
|
|
$ |
46,468 |
|
|
$ |
37,846 |
|
|
$ |
6,693 |
|
|
$ |
18,560 |
|
|
$ |
109,567 |
|
|
Goodwill (1) |
|
$ |
46,201 |
|
|
$ |
44,976 |
|
|
$ |
972 |
|
|
$ |
— |
|
|
$ |
92,149 |
|
|
$ |
457,241 |
|
|
$ |
27,475 |
|
|
$ |
— |
|
|
$ |
576,865 |
|
|
(1) |
As of the end of the fiscal year. |
Fee revenue attributed to an individual customer or country, other than the U.S. and United Kingdom, did not account for more than 10% of the total fee revenue in fiscal 2019, 2018 or 2017. Fee revenue classified by country in which the Company derives revenues are as follows:
|
|
|
Year Ended April 30, |
|
|||||||||
|
|
|
2019 |
|
|
2018 |
|
|
2017 |
|
|||
|
|
|
(in thousands) |
|
|||||||||
|
U.S. |
|
$ |
859,969 |
|
|
$ |
778,470 |
|
|
$ |
728,871 |
|
|
United Kingdom |
|
|
202,055 |
|
|
|
176,091 |
|
|
|
145,551 |
|
|
Other countries |
|
|
864,009 |
|
|
|
812,656 |
|
|
|
691,099 |
|
|
Total fee revenue |
|
$ |
1,926,033 |
|
|
$ |
1,767,217 |
|
|
$ |
1,565,521 |
|
F-38
KORN FERRY AND SUBSIDIARIES
NOTES TO CONSOLIDATED FINANCIAL STATEMENTS
April 30, 2019 (continued)
Other than the U.S., no single country controlled over 10% of the total long-lived assets, excluding financial instruments and tax assets. Long-lived assets, excluding financial instruments and tax assets, classified by controlling country are as follows:
|
|
|
Year Ended April 30, |
|
|||||||||
|
|
|
2019 |
|
|
2018 |
|
|
2017 |
|
|||
|
|
|
(in thousands) |
|
|||||||||
|
U.S. (1) |
|
$ |
98,455 |
|
|
$ |
80,424 |
|
|
$ |
70,949 |
|
|
Other countries |
|
|
33,050 |
|
|
|
39,477 |
|
|
|
38,618 |
|
|
Total long-lived assets |
|
$ |
131,505 |
|
|
$ |
119,901 |
|
|
$ |
109,567 |
|
|
(1) |
Includes Corporate long-lived assets |
12. Restructuring Charges, Net
During fiscal 2016, the Company implemented a restructuring plan in order to rationalize its cost structure by eliminating redundant positions and consolidating office space due to the acquisition of Hay Group on December 1, 2015. The Company continued the implementation of the fiscal 2016 restructuring plan in fiscal 2017 and 2018. This resulted in restructuring charges of $0.1 million in fiscal 2018 related to the consolidation of premises and restructuring charges of $34.6 million in fiscal 2017, of which $16.0 million related to severance and $18.6 million related to the consolidation of premises. No restructuring charges, net were incurred in fiscal 2019.
13. Goodwill and Intangible Assets
Changes in the carrying value of goodwill by reportable segment were as follows:
|
|
|
Executive Search |
|
|
|
|
|
|
|
|
|
|
|
|
|
|||||||||||||
|
|
|
North America |
|
|
EMEA |
|
|
Asia Pacific |
|
|
Subtotal |
|
|
Advisory |
|
|
RPO & Professional Search |
|
|
Consolidated |
|
|||||||
|
|
|
(in thousands) |
|
|||||||||||||||||||||||||
|
Balance as of May 1, 2017 |
|
$ |
46,201 |
|
|
$ |
44,976 |
|
|
$ |
972 |
|
|
$ |
92,149 |
|
|
$ |
457,241 |
|
|
$ |
27,475 |
|
|
$ |
576,865 |
|
|
Exchange rate fluctuations |
|
|
1,556 |
|
|
|
2,525 |
|
|
|
— |
|
|
|
4,081 |
|
|
|
928 |
|
|
|
2,348 |
|
|
|
7,357 |
|
|
Balance as of April 30, 2018 |
|
|
47,757 |
|
|
|
47,501 |
|
|
|
972 |
|
|
|
96,230 |
|
|
|
458,169 |
|
|
|
29,823 |
|
|
|
584,222 |
|
|
Exchange rate fluctuations |
|
|
(1,186 |
) |
|
|
(2,021 |
) |
|
|
— |
|
|
|
(3,207 |
) |
|
|
(808 |
) |
|
|
(1,909 |
) |
|
|
(5,924 |
) |
|
Balance as of April 30, 2019 |
|
$ |
46,571 |
|
|
$ |
45,480 |
|
|
$ |
972 |
|
|
$ |
93,023 |
|
|
$ |
457,361 |
|
|
$ |
27,914 |
|
|
$ |
578,298 |
|
Tax deductible goodwill from the PIVOT Leadership acquisition was $7.1 million and $7.0 million as of April 30, 2019 and 2018, respectively.
Intangible assets include the following:
|
|
|
April 30, 2019 |
|
|
April 30, 2018 |
|
||||||||||||||||||
|
|
|
(in thousands) |
|
|||||||||||||||||||||
|
Amortized intangible assets: |
|
Gross |
|
|
Accumulated Amortization |
|
|
Net |
|
|
Gross |
|
|
Accumulated Amortization |
|
|
Net |
|
||||||
|
Customer lists |
|
$ |
125,099 |
|
|
$ |
(53,352 |
) |
|
$ |
71,747 |
|
|
$ |
125,099 |
|
|
$ |
(42,248 |
) |
|
$ |
82,851 |
|
|
Intellectual property |
|
|
33,100 |
|
|
|
(22,045 |
) |
|
|
11,055 |
|
|
|
33,100 |
|
|
|
(20,112 |
) |
|
|
12,988 |
|
|
Proprietary databases |
|
|
4,256 |
|
|
|
(4,053 |
) |
|
|
203 |
|
|
|
4,256 |
|
|
|
(3,628 |
) |
|
|
628 |
|
|
Non-compete agreements |
|
|
910 |
|
|
|
(893 |
) |
|
|
17 |
|
|
|
910 |
|
|
|
(873 |
) |
|
|
37 |
|
|
Trademarks |
|
|
3,986 |
|
|
|
(3,986 |
) |
|
|
— |
|
|
|
3,986 |
|
|
|
(3,986 |
) |
|
|
— |
|
|
Total |
|
$ |
167,351 |
|
|
$ |
(84,329 |
) |
|
|
83,022 |
|
|
$ |
167,351 |
|
|
$ |
(70,847 |
) |
|
|
96,504 |
|
|
Unamortized intangible assets: |
|
|
|
|
|
|
|
|
|
|
|
|
|
|
|
|
|
|
|
|
|
|
|
|
|
Trademarks |
|
|
|
|
|
|
|
|
|
|
— |
|
|
|
|
|
|
|
|
|
|
|
106,000 |
|
|
Exchange rate fluctuations |
|
|
|
|
|
|
|
|
|
|
(74 |
) |
|
|
|
|
|
|
|
|
|
|
712 |
|
|
Total Intangible assets |
|
|
|
|
|
|
|
|
|
$ |
82,948 |
|
|
|
|
|
|
|
|
|
|
$ |
203,216 |
|
F-39
KORN FERRY AND SUBSIDIARIES
NOTES TO CONSOLIDATED FINANCIAL STATEMENTS
April 30, 2019 (continued)
During fiscal 2019, the Company decided to further integrate our go-to-market activities under one master brand —Korn Ferry, and discontinued the use of all sub-brands. Two of the Company’s sub-brands, Hay Group and Lominger, came to Korn Ferry through acquisitions. As a result of the decision to discontinue their use, the Company took a non-cash intangible asset impairment charge of $106.6 million during the year ended April 30, 2019, recorded in general and administrative expenses.
Amortization expense for amortized intangible assets was $13.5 million, $14.7 million and $15.4 million during fiscal 2019, 2018 and 2017, respectively. Estimated annual amortization expense related to amortizing intangible assets is as follows:
|
Year Ending April 30, |
|
Estimated Annual Amortization Expense |
|
|
|
|
|
(in thousands) |
|
|
|
2020 |
|
$ |
13,204 |
|
|
2021 |
|
|
13,071 |
|
|
2022 |
|
|
13,060 |
|
|
2023 |
|
|
11,208 |
|
|
2024 |
|
|
8,731 |
|
|
Thereafter |
|
|
23,748 |
|
|
|
|
$ |
83,022 |
|
All amortizable intangible assets will be fully amortized by the end of fiscal 2032.
14. Commitments and Contingencies
Lease Commitments
The Company leases office premises and certain office equipment under leases expiring at various dates through 2030. Total rental expense during fiscal 2019, 2018 and 2017 amounted to $58.2 million, $57.6 million and $56.8 million, respectively.
Future minimum commitments under non-cancelable operating leases with lease terms in excess of one year excluding commitments accrued in the restructuring liability are as follows:
|
Year Ending April 30, |
|
Lease Commitments |
|
|
|
|
|
(in thousands) |
|
|
|
2020 |
|
$ |
55,351 |
|
|
2021 |
|
|
52,567 |
|
|
2022 |
|
|
45,465 |
|
|
2023 |
|
|
38,582 |
|
|
2024 |
|
|
34,008 |
|
|
Thereafter |
|
|
74,764 |
|
|
|
|
$ |
300,737 |
|
Employment Agreements
The Company has a policy of entering into offer letters of employment or letters of promotion with vice presidents, which provide for an annual base salary and discretionary and incentive bonus payments. Certain key vice presidents who typically have been employed by the Company for several years may also have a standard form employment agreement. Upon termination without cause, the Company is required to pay the amount of severance due under the employment agreement, if any. The Company also requires its vice presidents to agree in their employment letters and their employment agreement, if applicable, not to compete with the Company during the term of their employment and for a certain period after their employment ends.
F-40
KORN FERRY AND SUBSIDIARIES
NOTES TO CONSOLIDATED FINANCIAL STATEMENTS
April 30, 2019 (continued)
From time to time, the Company has been and is involved in litigation incidental to its business. The Company is currently not a party to any litigation which, if resolved adversely against the Company, would, in the opinion of management, after consultation with legal counsel, have a material adverse effect on the Company’s business, financial position or results of operations.
15. Quarterly Results (Unaudited)
The following table sets forth certain unaudited consolidated statements of income data for the quarters in fiscal 2019 and 2018. The unaudited quarterly information has been prepared on the same basis as the annual financial statements and, in management’s opinion, includes all adjustments necessary to present fairly the information for the quarters presented.
|
|
|
Quarters Ended |
|
|||||||||||||||||||||||||||||
|
|
|
Fiscal 2019 |
|
|
Fiscal 2018 |
|
||||||||||||||||||||||||||
|
|
|
April 30 |
|
|
January 31 |
|
|
October 31 |
|
|
July 31 |
|
|
April 30 |
|
|
January 31 |
|
|
October 31 |
|
|
July 31 |
|
||||||||
|
|
|
(in thousands, except per share data) |
|
|||||||||||||||||||||||||||||
|
Fee revenue |
|
$ |
490,756 |
|
|
$ |
474,504 |
|
|
$ |
495,205 |
|
|
$ |
465,568 |
|
|
$ |
475,364 |
|
|
$ |
447,581 |
|
|
$ |
443,018 |
|
|
$ |
401,254 |
|
|
Operating income (loss) |
|
$ |
62,275 |
|
|
$ |
62,683 |
|
|
$ |
70,987 |
|
|
$ |
(55,119 |
) |
|
$ |
64,197 |
|
|
$ |
49,846 |
|
|
$ |
52,468 |
|
|
$ |
41,935 |
|
|
Net income (loss) |
|
$ |
50,627 |
|
|
$ |
45,444 |
|
|
$ |
47,317 |
|
|
$ |
(38,592 |
) |
|
$ |
42,309 |
|
|
$ |
27,427 |
|
|
$ |
36,732 |
|
|
$ |
29,429 |
|
|
Net income (loss) attributable to Korn Ferry |
|
$ |
50,264 |
|
|
$ |
44,964 |
|
|
$ |
46,034 |
|
|
$ |
(38,611 |
) |
|
$ |
41,160 |
|
|
$ |
27,247 |
|
|
$ |
36,331 |
|
|
$ |
29,041 |
|
|
Net earnings (loss) per common share: |
|
|
|
|
|
|
|
|
|
|
|
|
|
|
|
|
|
|
|
|
|
|
|
|
|
|
|
|
|
|
|
|
|
Basic |
|
$ |
0.90 |
|
|
$ |
0.81 |
|
|
$ |
0.82 |
|
|
$ |
(0.70 |
) |
|
$ |
0.74 |
|
|
$ |
0.49 |
|
|
$ |
0.65 |
|
|
$ |
0.52 |
|
|
Diluted |
|
$ |
0.89 |
|
|
$ |
0.80 |
|
|
$ |
0.81 |
|
|
$ |
(0.70 |
) |
|
$ |
0.73 |
|
|
$ |
0.48 |
|
|
$ |
0.64 |
|
|
$ |
0.51 |
|
16. Subsequent Event
Quarterly Dividend Declaration
On June 20, 2019, the Board of Directors of the Company declared a cash dividend of $0.10 per share with a payment date of July 31, 2019 to holders of the Company’s common stock of record at the close of business on July 2, 2019. The declaration and payment of future dividends under the quarterly dividend policy will be at the discretion of the Board of Directors and will depend upon many factors, including the Company’s earnings, capital requirements, financial conditions, the terms of the Company’s indebtedness and other factors that the Board of Directors may deem to be relevant. The Board may amend, revoke or suspend the dividend policy at any time and for any reason.
F-41
KORN FERRY AND SUBSIDIARIES
SCHEDULE II – VALUATION AND QUALIFYING ACCOUNTS
April 30, 2019
|
Column A |
|
Column B |
|
|
Column C |
|
|
Column D |
|
|
Column E |
|
||||||||
|
|
|
|
|
|
|
Additions |
|
|
|
|
|
|
|
|
|
|||||
|
Description |
|
Balance at Beginning of Period |
|
|
Charges to Cost and Expenses |
|
|
Recoveries (Charges) to Other Accounts (1) |
|
|
Deductions (2) |
|
|
Balance at End of Period |
|
|||||
|
|
|
(in thousands) |
|
|||||||||||||||||
|
Allowance for doubtful accounts: |
|
|
|
|
|
|
|
|
|
|
|
|
|
|
|
|
|
|
|
|
|
Year Ended April 30, 2019 |
|
$ |
17,845 |
|
|
$ |
14,260 |
|
|
$ |
(826 |
) |
|
$ |
(9,697 |
) |
|
$ |
21,582 |
|
|
Year Ended April 30, 2018 |
|
$ |
15,455 |
|
|
$ |
13,675 |
|
|
$ |
551 |
|
|
$ |
(11,836 |
) |
|
$ |
17,845 |
|
|
Year Ended April 30, 2017 |
|
$ |
11,292 |
|
|
$ |
12,987 |
|
|
$ |
(415 |
) |
|
$ |
(8,409 |
) |
|
$ |
15,455 |
|
|
|
|
|
|
|
|
|
|
|
|
|
|
|
|
|
|
|
|
|
|
|
|
Deferred tax asset valuation allowance: |
|
|
|
|
|
|
|
|
|
|
|
|
|
|
|
|
|
|
|
|
|
Year Ended April 30, 2019 |
|
$ |
15,682 |
|
|
$ |
5,170 |
|
|
$ |
— |
|
|
$ |
(6,820 |
) |
|
$ |
14,032 |
|
|
Year Ended April 30, 2018 |
|
$ |
21,278 |
|
|
$ |
3,421 |
|
|
$ |
— |
|
|
$ |
(9,017 |
) |
|
$ |
15,682 |
|
|
Year Ended April 30, 2017 |
|
$ |
22,030 |
|
|
$ |
7,931 |
|
|
$ |
— |
|
|
$ |
(8,683 |
) |
|
$ |
21,278 |
|
|
(1) |
Exchange rate fluctuations. |
|
(2) |
Allowance for doubtful accounts represents accounts written-off, net of recoveries and deferred tax asset valuation represents release of prior valuation allowances. |
F-42