CORRESP: A correspondence can be sent as a document with another submission type or can be sent as a separate submission.
Published on April 22, 2021
[KORN FERRY LETTERHEAD]
April 21, 2021
Securities and Exchange Commission
Division of Corporation Finance
Office of Trade & Services
100 F Street, N.E.
Washington, D.C. 20549
Attn: Suying Li and Rufus Decker
VIA EDGAR
| Re: | Korn Ferry |
Form 10-K for the Fiscal Year Ended April 30, 2020
Filed July 15, 2020
File No. 001-14505
Dear Ms. Li and Mr. Decker,
This letter is a follow-up to our conference call on March 30, 2021 and is a supplement to our letters to you dated March 15, 2021 and April 7, 2021, which were in response to your letter dated March 4, 2021, regarding Korn Ferrys (the Company) annual report on Form 10-K for the fiscal year ended April 30, 2020 (filed July 15, 2020).
Form 10-K for the Fiscal Year Ended April 30, 2020
Consolidated Financial Statements
Note 11. Segments, Page F-38
As discussed during our March 30, 2021 conference call, the following provides a description of our internal management system and includes proposed changes to information disclosed about our reportable segments.
Our management system begins with the Annual Operating Plan (the AOP). As we begin the AOP process, the CEO (the CODM) and CFO set Fee Revenue, Adjusted EBITDA, and Adjusted EBITDA Margin targets (financial targets) for Consulting, Digital, and RPOPS on a global basis. In the case of Executive Search (ES), the same financial targets are set, but we set them separately for each Region North America, Latin America, Europe, Middle East, and Africa, and Asia Pacific. Upon receiving targets, each line of business and, in the case of ES, each Region builds a plan that includes the level of new business and the incremental resources required to achieve the targets. As a professional services people business, the primary resource allocation decisions made by the CODM are focused on hiring fee earners and execution/delivery resources.
As we begin our fiscal year and for each quarterly reporting period, as outlined above, the CODM receives new business and fee revenue reports for each month. For the first two months of a quarter, the CODMs review of segment Adjusted EBITDA is conducted informally, through conversation with the CFO. For the last month of the quarter, the CODM receives the earnings call deck that described in our prior letter. The CODM uses the monthly new business and fee revenue reports and the Adjusted EBITDA from the quarterly earnings call deck to assess performance and to determine if any changes are required for resource allocation decisions i.e., whether to stay the course or increase or decrease hiring activities.
The CODM does not use operating income information even though it is included in the Appendix of the earnings call deck that is provided to him. Instead, he uses Adjusted EBITDA because it facilitates comparisons to historical performance and the financial targets set as part of the AOP process, clearer analyses of potential future performance and forward earnings potential, and the identification of trends, in each case without the distortion that may be caused by less predictable charges and events. In addition, as discussed on our call, the mark-to-market adjustments for assets held in trust for deferred compensation programs is required by US GAAP to be recorded in other income which is below operating income. The mark-to-market adjustment for the deferred compensation obligations is required to be recorded in compensation expense which falls within operating income. These amounts, which essentially offset each other, are both included in Adjusted EBITDA, making that financial metric a more reliable management tool from the CODMs perspective. Last, in our conversations with sell-side and buy-side analysts and portfolio managers, the firms results are always discussed in terms of Adjusted EBITDA, further reinforcing the CODMs use of this financial metric.
On our call, we discussed several changes to our reporting:
| 1) | Tables in our Segment footnote Going forward, we will no longer reconcile operating income to Adjusted EBITDA for Consulting, Digital, RPOPS, each Region for ES, and Corporate. We will not do this because under ASC 280, Adjusted EBITDA is deemed to be a GAAP measure for our reportable segments as it is the measure of profit and loss used by the CODM in allocating resources. We will also eliminate the ES subtotal column, as discussed on our call. With respect to the Consolidated column, ASC 280 specifically requires a reconciliation of the total of reportable segment revenues, profit or loss measurement and assets reported to the corresponding consolidated GAAP totals. Accordingly, the reconciliation for Consolidated Adjusted EBITDA will be to Net Income Attributable to Korn Ferry which is deemed to be the closest and most relevant GAAP number. |
To the extent that reconciling items between operating income and Adjusted EBITDA (on a reportable segment basis) are no longer presented but are still required to be disclosed by ASC 280, such amounts will be included in the footnote in narrative format.
See Appendix 1 for mock-up.
Note that the table discussed above is also presented in our earnings press release and in our MD&A. Both of those presentations will be changed to be consistent with the table in the footnote with one exception they will include the ES combined subtotal for Adjusted EBITDA and Adjusted EBITDA margin to present these measures by our Lines of Business, which is important as a number of our investors analyze our financial results this way. For these combined subtotals, we will also include a sentence identifying the combined subtotals for Adjusted EBITDA and Adjusted EBITDA margin as non-GAAP disclosures along with a description of why we presented them.
See tables in the Results of Operations section of the MD&A write-up in Appendix 2.
| 2) | MD&A As we discussed on our call, our MD&A will be modified to align to our segment footnote. More specifically, our discussion around ES Fee Revenue, Compensation and Benefits, General and Administrative Expenses, and Adjusted EBITDA will be done for each Region. We will no longer present a discussion around each of the above areas for combined ES nor will we discuss operating income trends. |
See Appendix 2 for mock-up.
| 3) | Earnings call deck Per the above, the earnings call deck only includes one page for ES and, with the exception of fee revenue, presents the other financial metrics on a combined basis. We have modified the slide so that both Fee Revenue and Adjusted EBITDA are presented on a Regional basis (consistent with how this information has been considered by the CODM historically) in addition to a combined, Line of Business basis. |
See Appendix 3 for mock-up.
We appreciate the Staffs responsiveness with respect to the Companys filing and look forward to resolving any concerns the Staff may have. If you have any questions, please contact me at (310) 226-6366 or Ari Lanin of Gibson, Dunn & Crutcher LLP at (310) 552-8581.
| Sincerely, |
| /s/ Robert P. Rozek |
| Robert P. Rozek |
| Executive Vice President, Chief Financial Officer & Chief |
| Corporate Officer |
| cc: | Don Ferrera, Ernst & Young LLP (via electronic mail) |
Ari Lanin, Gibson, Dunn & Crutcher LLP (via electronic mail)
Appendix 1 Table in Our Segment Footnote
11. Segments
The Company has invested in its digital business over the past year in order to digitize and harmonize the structure of its IP content and data and to build a technology platform for the efficient delivery of these assets directly to an end consumer or indirectly through a consulting engagement. These investments, combined with the acquisition of the Acquired Companies, resulted in a reassessment in the third quarter of fiscal 2020 of how the Company managed its former Advisory reportable segment. Given the Companys strategy and development of financial and operational metrics for the Consulting and Digital reportable segments, the Companys chief operating decision maker (CODM) had begun to make resource allocation decisions and assess performance separately between Consulting and Digital. Therefore, on November 1, 2019, the Company changed the composition of its reportable segments, and under the new reporting format, the Advisory reportable segment was separated into two reportable segments: Consulting and Digital. As a result, the Company now has seven reportable segments: Consulting, Digital, Executive Search North America, Executive Search EMEA, Executive Search Asia Pacific, Executive Search Latin America and RPO & Professional Search. Revenues are directly attributed to a reportable segment and expenses not directly associated with a specific segment are allocated based on the most relevant measures applicable, including revenues, headcount, and other factors.
The Companys seven reportable segments operate through four lines of business:
| 1. | Consulting helps clients synchronize their strategy and their talent by addressing four fundamental needs: Organizational Strategy, Assessment and Succession, Leadership and Professional Development, and Rewards and Benefits. This work is supported and underpinned by a comprehensive range of some of the worlds leading lP and data. |
| 2. | Digital leverages an artificial intelligence powered platform to identify structure, roles, capabilities, and behaviors needed to drive business forward. This end-to-end system gives clients one enterprise-wide talent framework and delivers an achievable blueprint for success along with the guidance and tools to deliver it. |
| 3. | Executive Search helps organizations recruit board level, chief executive and other senior executive and general management talent. Behavioral interviewing and proprietary assessments are used to determine ideal organizational fit, and salary benchmarking builds appropriate frameworks for compensation and retention. |
| 4. | RPO and Professional Search combines people, process expertise and IP-enabled technology to deliver enterprise talent acquisition solutions to clients. Transaction sizes range from single professional searches to team, department and line of business projects, and global outsource recruiting solutions. |
Executive Search is managed by geographic regional leaders. Worldwide operations for Consulting, Digital, and RPO and Professional Search are managed by their Chief Executive Officers. The Executive Search geographic regional leaders and the Chief Executive Officers of Consulting, Digital, and RPO & Professional Search report directly to the Chief Executive Officer of the Company. The Company also operates Corporate to record global expenses.
The Company evaluates performance and allocates resources based on the CODMs review of 1) fee revenue and 2) adjusted earnings before interest, taxes, depreciation and amortization (Adjusted EBITDA). To the extent that such costs or charges occur, Adjusted EBITDA excludes restructuring charges, integration/acquisition costs, certain separation costs and certain non-cash charges (goodwill, intangible asset and other impairment charges). The CODM is not provided asset information by reportable segment.
Financial highlights by reportable segments are as follows:
| Three Months Ended January 31, 2021 | ||||||||||||||||||||||||||||||||||||
| Executive Search | ||||||||||||||||||||||||||||||||||||
| Consulting | Digital |
North America |
EMEA | Asia Pacific |
Latin America |
RPO & Professional Search |
Corporate | Consolidated | ||||||||||||||||||||||||||||
| (in thousands) | ||||||||||||||||||||||||||||||||||||
| Fee revenue |
$ | 136,268 | $ | 75,791 | $ | 106,002 | $ | 35,991 | $ | 21,643 | $ | 4,468 | $ | 95,197 | $ | | $ | 475,360 | ||||||||||||||||||
| Total revenue |
$ | 136,593 | $ | 75,967 | $ | 106,325 | $ | 36,016 | $ | 21,680 | $ | 4,468 | $ | 96,831 | $ | | $ | 477,880 | ||||||||||||||||||
| Net income attributable to Korn Ferry |
|
$ | 51,319 | |||||||||||||||||||||||||||||||||
| Net income attributable to noncontrolling interest |
269 | |||||||||||||||||||||||||||||||||||
| Other income, net |
(14,935 | ) | ||||||||||||||||||||||||||||||||||
| Interest expense, net |
7,298 | |||||||||||||||||||||||||||||||||||
| Income tax provision |
21,204 | |||||||||||||||||||||||||||||||||||
|
|
|
|||||||||||||||||||||||||||||||||||
| Operating income |
$ | 65,155 | ||||||||||||||||||||||||||||||||||
| Depreciation and amortization |
15,735 | |||||||||||||||||||||||||||||||||||
| Other income, net |
14,935 | |||||||||||||||||||||||||||||||||||
| Restructuring charges, net |
838 | |||||||||||||||||||||||||||||||||||
|
|
|
|||||||||||||||||||||||||||||||||||
| Adjusted EBITDA(1) |
$ | 27,515 | $ | 27,134 | $ | 30,941 | $ | 3,918 | $ | 6,375 | $ | 458 | $ | 19,630 | $ | (19,308 | ) | $ | 96,663 | |||||||||||||||||
|
|
|
|||||||||||||||||||||||||||||||||||
| (1) | Adjusted EBITDA refers to earnings before interest, taxes, depreciation and amortization and further excludes net restructuring charges. |
| Three Months Ended January 31, 2020 | ||||||||||||||||||||||||||||||||||||
| Executive Search | ||||||||||||||||||||||||||||||||||||
| Consulting | Digital |
North America |
EMEA | Asia Pacific |
Latin America |
RPO & Professional Search |
Corporate | Consolidated | ||||||||||||||||||||||||||||
| (in thousands) | ||||||||||||||||||||||||||||||||||||
| Fee revenue |
$ | 140,525 | $ | 99,389 | $ | 106,888 | $ | 44,301 | $ | 25,089 | $ | 7,283 | $ | 91,850 | $ | | $ | 515,325 | ||||||||||||||||||
| Total revenue |
$ | 144,298 | $ | 100,663 | $ | 110,230 | $ | 45,077 | $ | 25,365 | $ | 7,351 | $ | 94,995 | $ | | $ | 527,979 | ||||||||||||||||||
| Net income attributable to Korn Ferry |
$ | 19,993 | ||||||||||||||||||||||||||||||||||
| Net income attributable to noncontrolling interest |
963 | |||||||||||||||||||||||||||||||||||
| Other income, net |
(5,055 | ) | ||||||||||||||||||||||||||||||||||
| Interest expense, net |
6,919 | |||||||||||||||||||||||||||||||||||
| Income tax provision |
8,775 | |||||||||||||||||||||||||||||||||||
|
|
|
|||||||||||||||||||||||||||||||||||
| Operating income |
$ | 31,595 | ||||||||||||||||||||||||||||||||||
| Depreciation and amortization |
14,863 | |||||||||||||||||||||||||||||||||||
| Other income, net |
5,055 | |||||||||||||||||||||||||||||||||||
| Integration/acquisition costs |
6,704 | |||||||||||||||||||||||||||||||||||
| Restructuring charges, net |
18,093 | |||||||||||||||||||||||||||||||||||
| Separation costs |
1,783 | |||||||||||||||||||||||||||||||||||
|
|
|
|||||||||||||||||||||||||||||||||||
| Adjusted EBITDA(1) |
$ | 18,699 | $ | 25,852 | $ | 26,618 | $ | 6,878 | $ | 5,505 | $ | 1,655 | $ | 15,211 | $ | (22,325 | ) | $ | 78,093 | |||||||||||||||||
|
|
|
|||||||||||||||||||||||||||||||||||
| (1) | Adjusted EBITDA refers to earnings before interest, taxes, depreciation and amortization and further excludes integration/acquisition costs, net restructuring charges and separation costs. |
| Nine Months Ended January 31, 2021 | ||||||||||||||||||||||||||||||||||||
| Executive Search | ||||||||||||||||||||||||||||||||||||
| Consulting | Digital |
North America |
EMEA | Asia Pacific |
Latin America |
RPO & Professional Search |
Corporate | Consolidated | ||||||||||||||||||||||||||||
| (in thousands) | ||||||||||||||||||||||||||||||||||||
| Fee revenue |
$ | 362,271 | $ | 206,807 | $ | 266,485 | $ | 97,701 | $ | 59,702 | $ | 12,419 | $ | 249,511 | $ | | $ | 1,254,896 | ||||||||||||||||||
| Total revenue |
$ | 363,234 | $ | 207,027 | $ | 267,790 | $ | 97,925 | $ | 59,840 | $ | 12,419 | $ | 254,317 | $ | | $ | 1,262,552 | ||||||||||||||||||
| Net income attributable to Korn Ferry |
|
$ | 48,264 | |||||||||||||||||||||||||||||||||
| Net income attributable to noncontrolling interest |
547 | |||||||||||||||||||||||||||||||||||
| Other income, net |
(26,374 | ) | ||||||||||||||||||||||||||||||||||
| Interest expense, net |
21,686 | |||||||||||||||||||||||||||||||||||
| Income tax provision |
25,409 | |||||||||||||||||||||||||||||||||||
|
|
|
|||||||||||||||||||||||||||||||||||
| Operating income |
$ | 69,532 | ||||||||||||||||||||||||||||||||||
| Depreciation and amortization |
46,068 | |||||||||||||||||||||||||||||||||||
| Other income, net |
26,374 | |||||||||||||||||||||||||||||||||||
| Integration/acquisition costs |
737 | |||||||||||||||||||||||||||||||||||
| Restructuring charges, net |
30,732 | |||||||||||||||||||||||||||||||||||
|
|
|
|||||||||||||||||||||||||||||||||||
| Adjusted EBITDA(1) |
$ | 54,282 | $ | 58,161 | $ | 57,439 | $ | 8,445 | $ | 11,610 | $ | 480 | $ | 39,453 | $ | (56,427 | ) | $ | 173,443 | |||||||||||||||||
|
|
|
|||||||||||||||||||||||||||||||||||
| (1) | Adjusted EBITDA refers to earnings before interest, taxes, depreciation and amortization and further excludes, integration/acquisition costs and net restructuring charges. |
| Nine Months Ended January 31, 2020 | ||||||||||||||||||||||||||||||||||||
| Executive Search | ||||||||||||||||||||||||||||||||||||
| Consulting | Digital |
North America |
EMEA | Asia Pacific |
Latin America |
RPO & Professional Search |
Corporate | Consolidated | ||||||||||||||||||||||||||||
| (in thousands) | ||||||||||||||||||||||||||||||||||||
| Fee revenue |
$ | 422,103 | $ | 223,097 | $ | 332,428 | $ | 130,652 | $ | 78,395 | $ | 23,140 | $ | 282,448 | $ | | $ | 1,492,263 | ||||||||||||||||||
| Total revenue |
$ | 433,832 | $ | 224,371 | $ | 342,753 | $ | 132,830 | $ | 79,201 | $ | 23,211 | $ | 292,156 | $ | | $ | 1,528,354 | ||||||||||||||||||
| Net income attributable to Korn Ferry |
|
$ | 105,748 | |||||||||||||||||||||||||||||||||
| Net income attributable to noncontrolling interest |
1,890 | |||||||||||||||||||||||||||||||||||
| Other income, net |
(8,014 | ) | ||||||||||||||||||||||||||||||||||
| Interest expense, net |
15,186 | |||||||||||||||||||||||||||||||||||
| Income tax provision |
38,988 | |||||||||||||||||||||||||||||||||||
|
|
|
|||||||||||||||||||||||||||||||||||
| Operating income |
$ | 153,798 | ||||||||||||||||||||||||||||||||||
| Depreciation and amortization |
40,355 | |||||||||||||||||||||||||||||||||||
| Other income, net |
8,014 | |||||||||||||||||||||||||||||||||||
| Integration/acquisition costs |
9,319 | |||||||||||||||||||||||||||||||||||
| Restructuring charges, net |
18,093 | |||||||||||||||||||||||||||||||||||
| Separation costs |
1,783 | |||||||||||||||||||||||||||||||||||
|
|
|
|||||||||||||||||||||||||||||||||||
| Adjusted EBITDA(1) |
$ | 49,990 | $ | 66,084 | $ | 88,611 | $ | 21,725 | $ | 19,063 | $ | 4,186 | $ | 47,456 | $ | (65,753 | ) | $ | 231,362 | |||||||||||||||||
|
|
|
|||||||||||||||||||||||||||||||||||
| (1) | Adjusted EBITDA refers to earnings before interest, taxes, depreciation and amortization and further excludes integration/acquisition costs, net restructuring charges and separation costs. |
Appendix 2 Introduction to MD&A
Executive Summary
Korn Ferry (referred to herein as the Company, or in the first-person notations we, our, and us) is a global organizational consulting firm. We help clients synchronize strategy and talent to drive superior performance. We work with organizations to design their structures, roles and responsibilities. We help them hire the right people to bring their strategy to life. And we advise them on how to reward, develop and motivate their people.
We are pursuing a strategy that will help Korn Ferry to focus on clients and collaborate intensively across the organization. This approach builds on the best of our past and gives us a clear path to the future with focused initiatives to increase our client and commercial impact. Korn Ferry is transforming how clients address their talent management needs. We have evolved from a mono-line to a diversified business, giving our consultants more frequent and expanded opportunities to engage with clients.
Our seven reportable segments operate through four lines of business:
| 1. | Consulting helps clients synchronize their strategy and their talent by addressing four fundamental needs: Organizational Strategy, Assessment and Succession, Leadership and Professional Development, and Rewards and Benefits. This work is supported and underpinned by a comprehensive range of some of the worlds leading lP and data. |
| 2. | Digital leverages an artificial intelligence (AI) powered platform to identify structure, roles, capabilities and behaviors needed to drive business forward. The end-to-end system gives clients one enterprise-wide talent framework and delivers an achievable blueprint for success, along with the guidance and tools to deliver it. |
| 3. | Executive Search helps organizations recruit board level, chief executive and other senior executive and general management talent. Behavioral interviewing and proprietary assessments are used to determine ideal organizational fit, and salary benchmarking builds appropriate frameworks for compensation and retention. |
| 4. | RPO and Professional Search combines people, process expertise and IP-enabled technology to deliver enterprise talent acquisition solutions to clients. Transaction sizes range from single professional searches to team, department and line of business projects, and global outsource recruiting solutions. |
Consulting and Digital are new reportable segments implemented in the third quarter of fiscal 2020. Previously, these were tracked and reported together as one reportable segment, Korn Ferry Advisory (Advisory). Over the past year, we have invested in the digital business and harmonized the structure of our content and data, building a technology platform for the efficient delivery of these assets directly to an end consumer or indirectly through a consulting engagement. These investments combined with the acquisitions of Miller Heiman Group, AchieveForum and Strategy Execution (collectively, the Acquired Companies) in November 2019 from TwentyEighty, Inc. for $108.6 million, resulted in a reassessment of how we managed our Advisory reportable segment. Therefore, beginning in the third quarter of fiscal 2020, we separated our Advisory reportable segment into two reportable segments in order to better align with the Companys strategy (which included the acquisition of the Acquired Companies) and the decisions of the Companys chief operating decision maker, who had begun to regularly make resource allocation decisions and assess performance separately between Consulting and Digital. As a result, the Company now has seven reportable segments: Consulting, Digital, Executive Search North America, Executive Search EMEA, Executive Search Asia Pacific, Executive Search Latin America and RPO & Professional Search.
The addition of the Acquired Companies has further expanded our vast IP and content and leveraged the firms digital delivery platforms. We have invested in our digital business to digitize and harmonize the structure of our IP content and data and in building a technology platform for the efficient delivery of these assets directly to an end consumer or indirectly through a consulting engagement.
| | Approximately 70% of the executive searches we performed in fiscal 2020 were for board level, chief executive and other senior executive and general management positions. Our 3,968 search engagement clients in fiscal 2020 included many of the worlds largest and most prestigious public and private companies. |
| | We have built strong client loyalty, with 90% of the assignments performed during fiscal 2020 having been on behalf of clients for whom we had conducted assignments in the previous three fiscal years. |
| | Approximately 71% of our revenues were generated from clients that utilized multiple lines of our business. |
| | A vital pillar of our growth strategy is Digital. Our data and IP are embedded into the core business processes of our clients, helping us generate long-term relationships through large scale and technology-based talent programs. |
| | In fiscal 2020, Korn Ferry was recognized as one of the top RPO providers in the Bakers Dozen list, marking our 13th consecutive year on the list. We were also named leader on the Everest PEAK Matrix for three years running and achieved star performer status in fiscal 2020. Through decades of experience, we have enhanced our RPO solution to deliver quality candidates that drive our clients business strategies. We leverage proprietary IP and data sets to guide clients on the critical skills and competencies to look for, compensation information to align with market demand, and assessment tools to ensure candidate fit. |
The Impact of COVID-19
In March 2020, COVID-19 was reported to have spread to over 100 countries, territories or areas, worldwide, and in the fourth quarter of fiscal 2020 the World Health Organization declared it a pandemic. The negative business impact of the coronavirus outbreak was initially most pronounced in the Asia Pacific region. During the first three quarters of fiscal 2021 the impact has been felt throughout all the geographical areas in which we do business. Governments and companies have implemented social distancinglimiting either travel or in person individual or group face-to-face interaction as well as working from home to adhere to stay at home orders from national, state and city governments. Such restrictions initially impacted our ability to provide our products and services to our clients with such impact lessening in the second and third quarters of fiscal 2021 as the world learned to work in different ways. Further, the outbreak has restricted the level of economic activity in the areas in which we operate and has had an adverse impact on demand for and sales of our products and services. All of our reportable segments across all of our geographies have been impacted as fee revenue decreased in the fourth quarter of fiscal 2020 and further decreased in the first quarter of fiscal 2021 due to a decrease in demand as clients responded to the pandemic. As a result of this and, as part of a broader program aimed at further enhancing our strong balance sheet and liquidity position, on April 20, 2020, we initiated a plan that was intended to adjust our cost base to the current economic environment and to position us to invest in the recovery. This plan included (i) a reduction in workforce, which was completed by the end of the first quarter of fiscal 2021 and resulted in restructuring charges of $40.5 million and $30.7 million associated with severance during the three months ended April 30, 2020 and the nine months ended January 31, 2021, respectively, (ii) the temporary furlough of certain employees, (iii) subject to certain exceptions and legal requirements, salary reductions across the organization through December 31, 2020, and (iv) other cost saving measures relating to general and administrative expenses.
In the third quarter of fiscal 2021, the Company saw business conditions improve substantially from where they were in the second and first quarter with fee revenues increasing 27% in the second quarter of fiscal 2021 compared to the first quarter, and 9% in the third quarter from the second quarter of fiscal 2021 to $475.4 million, with all reportable segments contributing to the improvement of fee revenue. As such, no further restructuring actions were taken in the quarter. With the sequential improvement in fee revenue and leveraging the restructured cost base, the Company experienced notably better profitability in the three months ended January 31, 2021 compared to the second quarter of fiscal 2021. As such, and similar to the decision that was made in the second quarter of the Companys 2021 fiscal year, the Company made a decision to pay all colleagues, including our named executive officers, their full salary and non-executive directors their full retainers for the third quarter of the Companys 2021 fiscal year as well. Employees have received such payments, subject in each case to such employees or directors continued employment or service with the Company on date of payment. Beginning on January 1, 2021 salaries of our employees were fully reinstated.
While advances have been made in the science and societal and economic consequences of COVID-19, there remains significant uncertainty about the future impacts of COVID-19. On the positive side, there have been several announcements around vaccines and governments around the world have begun distributing and administering the vaccine to designated high risk individuals. In addition, the world has adopted new ways of working and interacting with substantial acceptance of business being conducted in a virtual world. On the negative side, there have been challenges in manufacturing the vaccines at scale as well as distributing and administrating to the population at large. Since the end of the second quarter of fiscal 2021, we saw governments impose additional restrictions on travel and activities, particularly in Europe and in the United States, as the number of COVID-19 cases and hospitalizations continued to increase, reaching all-time highs in the United States. At the end of the third quarter, hospitalizations started to decrease and restrictions are starting to ease in some of the jurisdictions where we operate. However, there are also new, more contagious variants of the virus that preliminarily appear to be more resistant to the vaccines. It is therefore unknown whether the easing of the restrictions will continue or be reversed. With the implementation of the plan discussed above and the improved business activity we experienced in the second and third quarter, we believe our costs are in line with our current revenue levels. However, uncertainties such as whether the new variants of the virus become the dominant strain, or whether new restrictions are imposed (or prior restrictions re-imposed), make us unable to give assurance that the rate of increase in fee revenue during the three months ended January 31, 2021, will continue in the three months ended April 30, 2021. Given the amount available from our current revolver and the amount of cash and cash equivalents and marketable securities net of amounts held in trust for deferred compensation and accrued bonuses, we believe that we have sufficient liquidity to meet our anticipated working capital, capital expenditures, general corporate requirements, repayment of the debt obligations and dividend payments under our dividend policy in the next 12 months.
Performance Highlights
The Company evaluates performance and allocates resources based on the chief operating decision makers review of (1) fee revenue and (2) adjusted earnings before interest, taxes, depreciation and amortization (Adjusted EBITDA). To the extent that such costs or charges occur, Adjusted EBITDA excludes restructuring charges, integration/acquisition costs, certain separation costs and certain non-cash charges (goodwill, intangible asset and other than temporary impairments of investments). In the nine months ended January 31, 2021, Adjusted EBITDA excluded $30.7 million of restructuring charges and $0.7 million of integration/acquisition costs. In the three months ended January 31, 2021, Adjusted EBITDA excluded $0.8 million in restructuring charges, net.
The subtotals of Adjusted EBITDA and Adjusted EBITDA margin for the Executive Search reportable segments presented herein are non-GAAP financial measures. They have limitations as analytical tools, should not be viewed as a substitute for financial information determined in accordance with United States (U.S.) generally accepted accounting principles (GAAP), and should not be considered in isolation or as a substitute for analysis of the Companys results as reported under GAAP. In addition, they may not necessarily be comparable to non-GAAP performance measures that may be presented by other companies.
Management believes the presentation of these non-GAAP financial measures provides meaningful supplemental information regarding Korn Ferrys performance by excluding certain charges, items of income and other items that may not be indicative of Korn Ferrys ongoing operating results. The use of these non-GAAP financial measures facilitates comparisons to Korn Ferrys historical performance and the identification of operating trends that may otherwise be distorted by the factors discussed above. Korn Ferry includes these non-GAAP financial measures because management believes it is useful to investors in allowing for greater transparency with respect to supplemental information used by management in its evaluation of Korn Ferrys ongoing operations and financial and operational decision-making. The accounting policies for the reportable segments are the same as those described in the summary of significant accounting policies in the accompanying consolidated financial statements, except that the above noted items are excluded to arrive at Adjusted EBITDA. Management further believes that Adjusted EBITDA is useful to investors because it is frequently used by investors and other interested parties to measure operating performance among companies with different capital structures, effective tax rates and tax attributes and capitalized asset values, all of which can vary substantially from company to company.
Fee revenue was $475.4 million during the three months ended January 31, 2021, a decrease of $39.9 million, or 8%, compared to $515.3 million in the three months ended January 31, 2020 with decreases in fee revenue across Digital, Executive Search and Consulting lines of business due to a decline in demand for our products and services as a result of COVID-19, partially offset by an increase in fee revenue in RPO and Professional Search. Exchange rates favorably impacted fee revenue by $8.5 million, or 2%, in the three months ended January 31, 2021 compared to the year-ago quarter. Adjusted EBITDA in the three months ended January 31, 2021 was $96.7 million, an increase of $18.6 million as compared to $78.1 million in the year-ago quarter. During the three months ended January 31, 2021, the Executive Search, Consulting, Digital, and RPO & Professional Search lines of business contributed to Adjusted EBITDA of $41.7 million, $27.5 million, $27.1 million and $19.6 million, respectively, partially offset by Corporate expenses net of other income of $19.3 million. Net income attributable to Korn Ferry in the three months ended January 31, 2021 was $51.3 million, an increase of $31.3 million as compared to net income attributable to Korn Ferry of $20.0 million in the year-ago quarter.
Our cash, cash equivalents and marketable securities increased by $33.8 million to $897.1 million at January 31, 2021, compared to $863.3 million at April 30, 2020. This increase was mainly due to cash from operations as a result of cost savings initiatives that were put in place, a positive effect of exchange rate changes on cash and cash equivalents and proceeds from life insurance policies, partially offset by annual bonuses earned in fiscal 2020 and paid during the first quarter of fiscal 2021, retention payments, repurchases of our common stock in the open market, capital expenditures, interest payments on the 4.625% Senior Unsecured Notes due 2027 (the Notes) and dividends paid to stockholders during the nine months ended January 31, 2021. As of January 31, 2021, we held marketable securities to settle obligations under our Executive Capital Accumulation Plan (ECAP) with a cost value of $145.2 million and a fair value of $164.6 million. Our vested obligations for which these assets were held in trust totaled $147.1 million as of January 31, 2021 and our unvested obligations totaled $25.4 million.
Our working capital increased by $67.3 million to $680.2 million as of January 31, 2021, as compared to $612.9 million at April 30, 2020. We believe that cash on hand and funds from operations and other forms of liquidity will be sufficient to meet our anticipated working capital, capital expenditures, general corporate requirements, repayment of the debt obligations and dividend payments under our dividend policy in the next 12 months. We had $646.0 million available for borrowing under our current revolver at January 31, 2021 and April 30, 2020. As of January 31, 2021 and April 30, 2020, there was $4.0 million of standby letters of credit issued, under our credit agreement. We had a total of $10.7 million and $11.3 million of standby letters of credits with other financial institutions as of January 31, 2021 and April 30, 2020, respectively.
Results of Operations
The following table summarizes the results of our operations as a percentage of fee revenue:
(Numbers may not total exactly due to rounding)
|
Three Months Ended January 31, |
Nine Months Ended January 31, |
|||||||||||||||
| 2021 | 2020 | 2021 | 2020 | |||||||||||||
| Fee revenue |
100.0 | % | 100.0 | % | 100.0 | % | 100.0 | % | ||||||||
| Reimbursed out-of-pocket engagement expenses |
0.5 | 2.5 | 0.6 | 2.4 | ||||||||||||
|
|
|
|
|
|
|
|
|
|||||||||
| Total revenue |
100.5 | 102.5 | 100.6 | 102.4 | ||||||||||||
| Compensation and benefits |
68.6 | 67.6 | 73.1 | 68.0 | ||||||||||||
| General and administrative expenses |
9.9 | 13.8 | 11.2 | 13.3 | ||||||||||||
| Reimbursed expenses |
0.5 | 2.5 | 0.6 | 2.4 | ||||||||||||
| Cost of services |
4.2 | 6.0 | 4.0 | 4.4 | ||||||||||||
| Depreciation and amortization |
3.3 | 2.9 | 3.7 | 2.7 | ||||||||||||
| Restructuring charges, net |
0.2 | 3.5 | 2.4 | 1.2 | ||||||||||||
|
|
|
|
|
|
|
|
|
|||||||||
| Operating income |
13.7 | 6.1 | 5.5 | 10.3 | ||||||||||||
|
|
|
|
|
|
|
|
|
|||||||||
| Net income |
10.9 | % | 4.1 | % | 3.9 | % | 7.2 | % | ||||||||
|
|
|
|
|
|
|
|
|
|||||||||
| Net income attributable to Korn Ferry |
10.8 | % | 3.9 | % | 3.8 | % | 7.1 | % | ||||||||
|
|
|
|
|
|
|
|
|
|||||||||
The following tables summarize the results of our operations:
(Numbers may not total exactly due to rounding)
|
Three Months Ended January 31, |
Nine Months Ended January 31, |
|||||||||||||||||||||||||||||||
| 2021 | 2020 | 2021 | 2020 | |||||||||||||||||||||||||||||
| Dollars | % | Dollars | % | Dollars | % | Dollars | % | |||||||||||||||||||||||||
| (dollars in thousands) | ||||||||||||||||||||||||||||||||
| Fee revenue |
||||||||||||||||||||||||||||||||
| Consulting |
$ | 136,268 | 28.7 | % | $ | 140,525 | 27.3 | % | $ | 362,271 | 28.9 | % | $ | 422,103 | 28.3 | % | ||||||||||||||||
| Digital |
75,791 | 15.9 | 99,389 | 19.3 | 206,807 | 16.5 | 223,097 | 15.0 | ||||||||||||||||||||||||
| Executive Search: |
||||||||||||||||||||||||||||||||
| North America |
106,002 | 22.3 | 106,888 | 20.7 | 266,485 | 21.2 | 332,428 | 22.3 | ||||||||||||||||||||||||
| EMEA |
35,991 | 7.6 | 44,301 | 8.6 | 97,701 | 7.8 | 130,652 | 8.8 | ||||||||||||||||||||||||
| Asia Pacific |
21,643 | 4.6 | 25,089 | 4.9 | 59,702 | 4.8 | 78,395 | 5.3 | ||||||||||||||||||||||||
| Latin America |
4,468 | 0.9 | 7,283 | 1.4 | 12,419 | 1.0 | 23,140 | 1.6 | ||||||||||||||||||||||||
|
|
|
|
|
|
|
|
|
|
|
|
|
|
|
|
|
|||||||||||||||||
| Total Executive Search |
168,104 | 35.4 | 183,561 | 35.6 | 436,307 | 34.8 | 564,615 | 37.8 | ||||||||||||||||||||||||
| RPO & Professional Search |
95,197 | 20.0 | 91,850 | 17.8 | 249,511 | 19.9 | 282,448 | 18.9 | ||||||||||||||||||||||||
|
|
|
|
|
|
|
|
|
|
|
|
|
|
|
|
|
|||||||||||||||||
| Total fee revenue |
475,360 | 100.0 | % | 515,325 | 100.0 | % | 1,254,896 | 100.0 | % | 1,492,263 | 100.0 | % | ||||||||||||||||||||
|
|
|
|
|
|
|
|
|
|||||||||||||||||||||||||
| Reimbursed out-of-pocket engagement expense |
2,520 | 12,654 | 7,656 | 36,091 | ||||||||||||||||||||||||||||
|
|
|
|
|
|
|
|
|
|||||||||||||||||||||||||
| Total revenue |
$ | 477,880 | $ | 527,979 | $ | 1,262,552 | $ | 1,528,354 | ||||||||||||||||||||||||
|
|
|
|
|
|
|
|
|
|||||||||||||||||||||||||
In the tables that follow, the Company presents a subtotal for Executive Search Adjusted EBITDA and a single percentage for Executive Search Adjusted EBITDA margin, which reflects the aggregate of all of the individual Executive Search Regions. These figures are non-GAAP financial measures and are presented as they are consistent with the Companys Lines of Business and are financial metrics used by the Companys investor base.
| Three Months Ended January 31, 2021 | ||||||||||||||||||||||||||||||||||||||||
| Executive Search | ||||||||||||||||||||||||||||||||||||||||
| Consulting | Digital |
North America |
EMEA | Asia Pacific |
Latin America |
Subtotal |
RPO & Professional Search |
Corporate | Consolidated | |||||||||||||||||||||||||||||||
| (in thousands) | ||||||||||||||||||||||||||||||||||||||||
| Fee revenue |
$ | 136,268 | $ | 75,791 | $ | 106,002 | $ | 35,991 | $ | 21,643 | $ | 4,468 | $ | 168,104 | $ | 95,197 | $ | | $ | 475,360 | ||||||||||||||||||||
| Total revenue |
$ | 136,593 | $ | 75,967 | $ | 106,325 | $ | 36,016 | $ | 21,680 | $ | 4,468 | $ | 168,489 | $ | 96,831 | $ | | $ | 477,880 | ||||||||||||||||||||
| Net income attributable to Korn Ferry |
$ | 51,319 | ||||||||||||||||||||||||||||||||||||||
| Net income attributable to noncontrolling interest |
269 | |||||||||||||||||||||||||||||||||||||||
| Other income, net |
(14,935 | ) | ||||||||||||||||||||||||||||||||||||||
| Interest expense, net |
7,298 | |||||||||||||||||||||||||||||||||||||||
| Income tax provision |
21,204 | |||||||||||||||||||||||||||||||||||||||
|
|
|
|||||||||||||||||||||||||||||||||||||||
| Operating income |
$ | 65,155 | ||||||||||||||||||||||||||||||||||||||
| Depreciation and amortization |
15,735 | |||||||||||||||||||||||||||||||||||||||
| Other income, net |
14,935 | |||||||||||||||||||||||||||||||||||||||
| Restructuring charges, net |
838 | |||||||||||||||||||||||||||||||||||||||
|
|
|
|||||||||||||||||||||||||||||||||||||||
| Adjusted EBITDA |
$ | 27,515 | $ | 27,134 | $ | 30,941 | $ | 3,918 | $ | 6,375 | $ | 458 | $ | 41,692 | $ | 19,630 | $ | (19,308 | ) | $ | 96,663 | |||||||||||||||||||
|
|
|
|||||||||||||||||||||||||||||||||||||||
| Adjusted EBITDA margin |
20.2 | % | 35.8 | % | 29.2 | % | 10.9 | % | 29.5 | % | 10.3 | % | 24.8 | % | 20.6 | % | 20.3 | % | ||||||||||||||||||||||
| Three Months Ended January 31, 2020 | ||||||||||||||||||||||||||||||||||||||||
| Executive Search | ||||||||||||||||||||||||||||||||||||||||
| Consulting | Digital |
North America |
EMEA | Asia Pacific |
Latin America |
Subtotal |
RPO & Professional Search |
Corporate | Consolidated | |||||||||||||||||||||||||||||||
| (in thousands) | ||||||||||||||||||||||||||||||||||||||||
| Fee revenue |
$ | 140,525 | $ | 99,389 | $ | 106,888 | $ | 44,301 | $ | 25,089 | $ | 7,283 | $ | 183,561 | $ | 91,850 | $ | | $ | 515,325 | ||||||||||||||||||||
| Total revenue |
$ | 144,298 | $ | 100,663 | $ | 110,230 | $ | 45,077 | $ | 25,365 | $ | 7,351 | $ | 188,023 | $ | 94,995 | $ | | $ | 527,979 | ||||||||||||||||||||
| Net income attributable to Korn Ferry |
$ | 19,993 | ||||||||||||||||||||||||||||||||||||||
| Net income attributable to noncontrolling interest |
963 | |||||||||||||||||||||||||||||||||||||||
| Other income, net |
(5,055 | ) | ||||||||||||||||||||||||||||||||||||||
| Interest expense, net |
6,919 | |||||||||||||||||||||||||||||||||||||||
| Income tax provision |
8,775 | |||||||||||||||||||||||||||||||||||||||
|
|
|
|||||||||||||||||||||||||||||||||||||||
| Operating income loss |
$ | 31,595 | ||||||||||||||||||||||||||||||||||||||
| Depreciation and amortization |
14,863 | |||||||||||||||||||||||||||||||||||||||
| Other income, net |
5,055 | |||||||||||||||||||||||||||||||||||||||
| Integration/acquisition costs |
6,704 | |||||||||||||||||||||||||||||||||||||||
| Restructuring charges, net |
18,093 | |||||||||||||||||||||||||||||||||||||||
| Separation costs |
1,783 | |||||||||||||||||||||||||||||||||||||||
|
|
|
|||||||||||||||||||||||||||||||||||||||
| Adjusted EBITDA |
$ | 18,699 | $ | 25,852 | $ | 26,618 | $ | 6,878 | $ | 5,505 | $ | 1,655 | $ | 40,656 | $ | 15,211 | $ | (22,325 | ) | $ | 78,093 | |||||||||||||||||||
|
|
|
|||||||||||||||||||||||||||||||||||||||
| Adjusted EBITDA margin |
13.3 | % | 26.0 | % | 24.9 | % | 15.5 | % | 21.9 | % | 22.7 | % | 22.1 | % | 16.6 | % | 15.2 | % | ||||||||||||||||||||||
| Nine Months Ended January 31, 2021 | ||||||||||||||||||||||||||||||||||||||||
| Executive Search | ||||||||||||||||||||||||||||||||||||||||
| Consulting | Digital | North America |
EMEA | Asia Pacific |
Latin America |
Subtotal |
RPO & Professional Search |
Corporate | Consolidated | |||||||||||||||||||||||||||||||
| (in thousands) | ||||||||||||||||||||||||||||||||||||||||
| Fee revenue |
$ | 362,271 | $ | 206,807 | $ | 266,485 | $ | 97,701 | $ | 59,702 | $ | 12,419 | $ | 436,307 | $ | 249,511 | $ | | $ | 1,254,896 | ||||||||||||||||||||
| Total revenue |
$ | 363,234 | $ | 207,027 | $ | 267,790 | $ | 97,925 | $ | 59,840 | $ | 12,419 | $ | 437,974 | $ | 254,317 | $ | | $ | 1,262,552 | ||||||||||||||||||||
| Net income attributable to Korn Ferry |
$ | 48,264 | ||||||||||||||||||||||||||||||||||||||
| Net income attributable to noncontrolling interest |
547 | |||||||||||||||||||||||||||||||||||||||
| Other income, net |
(26,374 | ) | ||||||||||||||||||||||||||||||||||||||
| Interest expense, net |
21,686 | |||||||||||||||||||||||||||||||||||||||
| Income tax provision |
25,409 | |||||||||||||||||||||||||||||||||||||||
|
|
|
|||||||||||||||||||||||||||||||||||||||
| Operating income |
$ | 69,532 | ||||||||||||||||||||||||||||||||||||||
| Depreciation and amortization |
46,068 | |||||||||||||||||||||||||||||||||||||||
| Other income, net |
26,374 | |||||||||||||||||||||||||||||||||||||||
| Integration/acquisition costs |
737 | |||||||||||||||||||||||||||||||||||||||
| Restructuring charges, net |
30,732 | |||||||||||||||||||||||||||||||||||||||
|
|
|
|||||||||||||||||||||||||||||||||||||||
| Adjusted EBITDA |
$ | 54,282 | $ | 58,161 | $ | 57,439 | $ | 8,445 | $ | 11,610 | $ | 480 | $ | 77,974 | $ | 39,453 | $ | (56,427 | ) | $ | 173,443 | |||||||||||||||||||
|
|
|
|||||||||||||||||||||||||||||||||||||||
| Adjusted EBITDA margin |
15.0 | % | 28.1 | % | 21.6 | % | 8.6 | % | 19.4 | % | 3.9 | % | 17.9 | % | 15.8 | % | 13.8 | % | ||||||||||||||||||||||
| Nine Months Ended January 31, 2020 | ||||||||||||||||||||||||||||||||||||||||
| Executive Search | ||||||||||||||||||||||||||||||||||||||||
| Consulting | Digital |
North America |
EMEA | Asia Pacific |
Latin America |
Subtotal |
RPO & Professional Search |
Corporate | Consolidated | |||||||||||||||||||||||||||||||
| (in thousands) | ||||||||||||||||||||||||||||||||||||||||
| Fee revenue |
$ | 422,103 | $ | 223,097 | $ | 332,428 | $ | 130,652 | $ | 78,395 | $ | 23,140 | $ | 564,615 | $ | 282,448 | $ | | $ | 1,492,263 | ||||||||||||||||||||
| Total revenue |
$ | 433,832 | $ | 224,371 | $ | 342,753 | $ | 132,830 | $ | 79,201 | $ | 23,211 | $ | 577,995 | $ | 292,156 | $ | | $ | 1,528,354 | ||||||||||||||||||||
| Net income attributable to Korn Ferry |
$ | 105,748 | ||||||||||||||||||||||||||||||||||||||
| Net income attributable to noncontrolling interest |
1,890 | |||||||||||||||||||||||||||||||||||||||
| Other income, net |
(8,014 | ) | ||||||||||||||||||||||||||||||||||||||
| Interest expense, net |
15,186 | |||||||||||||||||||||||||||||||||||||||
| Income tax provision |
38,988 | |||||||||||||||||||||||||||||||||||||||
|
|
|
|||||||||||||||||||||||||||||||||||||||
| Operating income |
$ | 153,798 | ||||||||||||||||||||||||||||||||||||||
| Depreciation and amortization |
40,355 | |||||||||||||||||||||||||||||||||||||||
| Other income, net |
8,014 | |||||||||||||||||||||||||||||||||||||||
| Integration/acquisition costs |
9,319 | |||||||||||||||||||||||||||||||||||||||
| Restructuring charges, net |
18,093 | |||||||||||||||||||||||||||||||||||||||
| Separation costs |
1,783 | |||||||||||||||||||||||||||||||||||||||
|
|
|
|||||||||||||||||||||||||||||||||||||||
| Adjusted EBITDA |
$ | 49,990 | $ | 66,084 | $ | 88,611 | $ | 21,725 | $ | 19,063 | $ | 4,186 | $ | 133,585 | $ | 47,456 | $ | (65,753 | ) | $ | 231,362 | |||||||||||||||||||
|
|
|
|||||||||||||||||||||||||||||||||||||||
| Adjusted EBITDA margin |
11.8 | % | 29.6 | % | 26.7 | % | 16.6 | % | 24.3 | % | 18.1 | % | 23.7 | % | 16.8 | % | 15.5 | % | ||||||||||||||||||||||
Three Months Ended January 31, 2021 Compared to Three Months Ended January 31, 2020
Fee Revenue
Executive Search North America reported fee revenue of $106.0 million, a decrease of $0.9 million, or 1%, in the three months ended January 31, 2021 compared to $106.9 million in the year-ago quarter. The decrease in fee revenue was due to an 8% decrease in the number of engagements billed, partially offset by a 7% increase in the weighted-average fee billed per engagement (calculated using local currency) during the three months ended January 31, 2021 compared to the year-ago quarter.
Executive Search EMEA reported fee revenue of $36.0 million, a decrease of $8.3 million, or 19%, in the three months ended January 31, 2021 compared to $44.3 million in the year-ago quarter. The decrease in fee revenue was due to a 20% decrease in the number of engagements billed and a 4% decrease in the weighted-average fee billed per engagement (calculated using local currency) during the three months ended January 31, 2021 compared to the year-ago quarter. Exchange rates favorably impacted fee revenue by $2.4 million, or 5%, in the three months ended January 31, 2021 compared to the year-ago quarter. Performance in the United Kingdom, Switzerland, Germany and France were the primary contributors to the decrease in fee revenue in the three months ended January 31, 2021 compared to the year-ago quarter.
Executive Search Asia Pacific reported fee revenue of $21.6 million, a decrease of $3.5 million, or 14%, in the three months ended January 31, 2021 compared to $25.1 million in the year-ago quarter. The decrease in fee revenue was due to a 17% decrease in the weighted-average fees billed per engagement (calculated using local currency) during the three months ended January 31, 2021 compared to the year-ago quarter. Exchange rates favorably impacted fee revenue by $1.0 million, or 4%, in the three months ended January 31, 2021 compared to the year-ago quarter. The performance in Australia, Singapore and Hong Kong were the primary contributors to the decrease in fee revenue in the three months ended January 31, 2021 compared to the year-ago quarter.
Executive Search Latin America reported fee revenue of $4.5 million, a decrease of $2.8 million, or 38%, in the three months ended January 31, 2021 compared to $7.3 million in the year-ago quarter. The decrease in fee revenue was due to a 39% decrease in the number of engagements billed partially offset by a 10% increase in the weighted-average fee billed per engagement (calculated using local currency) during the three months ended January 31, 2021 compared to the year-ago quarter. Exchange rates unfavorably impacted fee revenue by $0.7 million, or 10%, in the three months ended January 31, 2021 compared to the year-ago quarter. The decrease in fee revenue in the region was due to lower fee revenue in Mexico, Chile and Brazil in the three months ended January 31, 2021 compared to the year-ago quarter.
Compensation and Benefits
Executive Search North America compensation and benefits expense increased by $7.5 million, or 10%, to $80.8 million in the three months ended January 31, 2021 from $73.3 million in the year-ago quarter. The increase in compensation and benefits expense was due to expenses associated with our deferred compensation and retirement plans driven by increases in the fair value of participants accounts in the three months ended January 31, 2021 compared to the year-ago quarter. This was partially offset by lower salaries and related payroll taxes due to a 24% decrease in average headcount as a result of actions taken to align our cost structure with the lower level of business demand in the three months ended January 31, 2021 compared to the year-ago quarter. North America Executive Search compensation and benefits expense, as a percentage of fee revenue, increased to 76% in the three months ended January 31, 2021 from 69% in the year-ago quarter.
Executive Search EMEA compensation and benefits expense decreased by $5.9 million, or 18%, to $27.8 million in the three months ended January 31, 2021 from $33.7 million in the year-ago quarter. Exchange rates unfavorably impacted compensation and benefits by $1.9 million, or 6%, in the three months ended January 31, 2021 compared to the year-ago quarter. The decrease in compensation and benefits expense was due to lower salaries and related payroll taxes and performance-related bonus expense both due to a 16% decrease in average headcount as a result of actions taken to align our cost structure with the lower level of business demand in the three months ended January 31, 2021 compared to the year-ago quarter. The rest of the change was due to lower severance expense due to management separation costs incurred in the year-ago quarter. EMEA Executive Search compensation and benefits expense, as a percentage of fee revenue, increased to 77% in the three months ended January 31, 2021 from 76% in the year-ago quarter.
Executive Search Asia Pacific compensation and benefits expense decreased by $3.6 million, or 21%, to $13.3 million in the three months ended January 31, 2021 from $16.9 million in the year-ago quarter. Exchange rates unfavorably impacted compensation and benefits by $0.6 million, or 4%, in the three months ended January 31, 2021 compared to the year-ago quarter. The decrease in compensation and benefits expense was due to lower salaries and related payroll taxes and performance-related bonus expense both due to a 23% decrease in average headcount as a result of actions taken to align our cost structure with the lower level of business demand in the three months ended January 31, 2021 compared to the year-ago quarter. Asia Pacific Executive Search compensation and benefits expense, as a percentage of fee revenue, decreased to 62% in the three months ended January 31, 2021 from 67% in the year-ago quarter.
Executive Search Latin America compensation and benefits expense decreased by $1.3 million, or 27%, to $3.5 million in the three months ended January 31, 2021 from $4.8 million in the year-ago quarter. Exchange rates favorably impacted compensation and benefits by $0.6 million, or 13%, in the three months ended January 31, 2021 compared to the year-ago quarter. The decrease in compensation and benefits expense was due to lower salaries and related payroll taxes and performance-related bonus expense due to a 25% decrease in average headcount as a result of actions taken to align our cost structure with the lower level of business demand in the three months ended January 31, 2021 compared to the year-ago quarter. Latin America Executive Search compensation and benefits expense, as a percentage of fee revenue, increased to 78% in the three months ended January 31, 2021 from 66% in the year-ago quarter.
General and Administrative Expenses
Executive Search North America general and administrative expenses decreased by $4.3 million, or 42%, to $5.9 million, in the three months ended January 31, 2021 compared to $10.2 million in the year-ago quarter. The decrease was mainly due to decreases in marketing and business development expenses, premise and office expenses and travel related expenses as a result of actions taken to align our cost structure with the lower level of business demand. North America Executive Search general and administrative expenses, as a percentage of fee revenue, decreased to 6% in the three months ended January 31, 2021 from 10% in the year-ago quarter.
Executive Search EMEA general and administrative expenses decreased by $1.1 million, or 20%, to $4.3 million, in the three months ended January 31, 2021 compared to $5.4 million in the year-ago quarter. The decrease was mainly due to decreases in marketing and business development expenses and travel related expenses as a result of actions taken to align our cost structure with the lower level of business demand. EMEA Executive Search general and administrative expenses, as a percentage of fee revenue, was 12% in both the three months ended January 31, 2021 and 2020.
Executive Search Asia Pacific general and administrative expenses decreased by $0.4 million, or 16%, to $2.1 million, in the three months ended January 31, 2021 compared to $2.5 million in the year-ago quarter. The decrease was mainly due to decreases in marketing and business development expenses, premise and office expenses and travel related expenses as a result of actions taken to align our cost structure with the lower level of business demand. Asia Pacific Executive Search general and administrative expenses, as a percentage of fee revenue, was 10% in both the three months ended January 31, 2021 and 2020.
Executive Search Latin America general and administrative expenses decreased by $0.6 million, or 55%, to $0.5 million, in the three months ended January 31, 2021 compared to $1.1 million in the year-ago quarter. The decrease was mainly due to decreases in premise and office expenses as a result of actions taken to align our cost structure with the lower level of business demand. Latin America Executive Search general and administrative expenses, as a percentage of fee revenue, decreased to 11% in the three months ended January 31, 2021 from 15% in the year-ago quarter.
Adjusted EBITDA
Executive Search North America Adjusted EBITDA increased $4.3 million, or 16%, to $30.9 million in the three months ended January 31, 2021 as compared to $26.6 million in the year-ago quarter. The increase was mainly driven by decreases in general and administrative expenses, which resulted from cost savings initiatives that were put in place in response to the COVID-19 pandemic. These changes were partially offset by lower fee revenue. North America Executive Search Adjusted EBITDA, as a percentage of fee revenue, was 29% and 25% in the three months ended January 31, 2021 and 2020, respectively.
Executive Search EMEA Adjusted EBITDA decreased $3.0 million, or 43%, to $3.9 million in the three months ended January 31, 2021 as compared to $6.9 million in the year-ago quarter. The decrease was mainly driven by lower fee revenue, which were partially offset by decreases in general and administrative expenses and compensation and benefits expense (excluding separation costs), all of which resulted from cost savings initiatives that were put in place in response to the COVID-19 pandemic. EMEA Executive Search Adjusted EBITDA, as a percentage of fee revenue, was 11% and 16% in the three months ended January 31, 2021 and 2020, respectively.
Executive Search Asia Pacific Adjusted EBITDA increased $0.9 million, or 16%, to $6.4 million in the three months ended January 31, 2021 as compared to $5.5 million in the year-ago quarter. The increase was mainly driven by decreases in general and administrative expenses and compensation and benefits expense, all of which resulted from cost savings initiatives that were put in place in response to the COVID-19 pandemic. These changes were partially offset by lower fee revenue. Asia Pacific Executive Search Adjusted EBITDA, as a percentage of fee revenue, was 29% and 22% in the three months ended January 31, 2021 and 2020, respectively.
Executive Search Latin America Adjusted EBITDA decreased $1.2 million, or 71%, to $0.5 million in the three months ended January 31, 2021 as compared to $1.7 million in the year-ago quarter. The decrease was mainly driven by a decline in fee revenue, partially offset by decreases in general and administrative expenses and compensation and benefits expense, all of which resulted from cost savings initiatives that were put in place in response to the COVID-19 pandemic. Latin America Executive Search Adjusted EBITDA, as a percentage of fee revenue, was 10% and 23% in the three months ended January 31, 2021 and 2020, respectively.
Appendix 3 ES Slide from our Earnings Call Deck
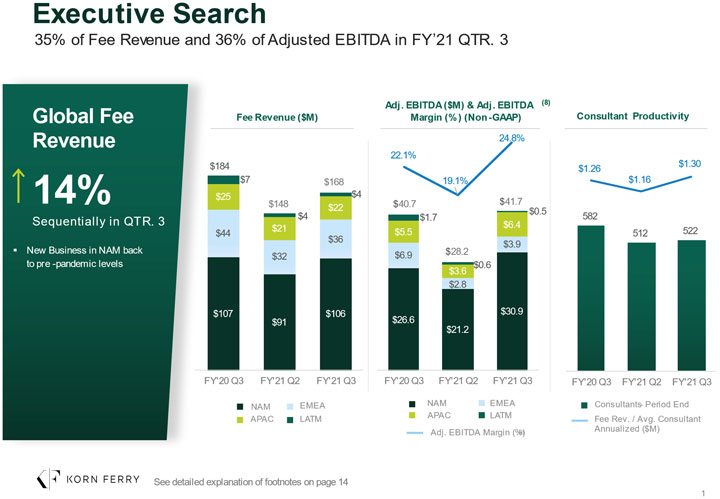
Executive Search 35% of Fee Revenue and 36% of adjusted EBITDA in FY21 QTR. 3 Global Fee Revenue 14% Sequentially in QTR. 3 new Business In NAM back to pre pandemic levels fee revenue ($m) KORN FERRY See detailed .