CORRESP: A correspondence can be sent as a document with another submission type or can be sent as a separate submission.
Published on April 8, 2021
[KORN FERRY LETTERHEAD]
April 7, 2021
Securities and Exchange Commission
Division of Corporation Finance
Office of Trade & Services
100 F Street, N.E.
Washington, D.C. 20549
Attn: Suying Li and Rufus Decker
VIA EDGAR
| Re: |
Korn Ferry | |
| Form 10-K for the Fiscal Year Ended April 30, 2020 | ||
| Filed July 15, 2020 | ||
| File No. 001-14505 |
Dear Ms. Li and Mr. Decker,
This letter is a follow-up to our conference call on March 30, 2021 and is a supplement to our letter to you dated March 15, 2021, which was in response to your letter dated March 4, 2021, regarding Korn Ferrys (the Company) annual report on Form 10-K for the fiscal year ended April 30, 2020 (filed July 15, 2020).
Form 10-K for the Fiscal Year Ended April 30, 2020
Consolidated Financial Statements
Note 11. Segments, Page F-38
As discussed during our March 30, 2021 conference call, the following provides a description of our internal management system and includes proposed changes to information disclosed about our segments.
Our management system begins with the Annual Operating Plan (AOP). As we begin the AOP process, the CEO (CODM) and CFO set Fee Revenue, Adjusted EBITDA, and Adjusted EBITDA Margin targets (financial targets) for Consulting, Digital, and RPOPS on a global basis. In the case of Executive Search (ES), the same financial targets are set, but we set them separately for each Region North America, Latin America, Europe, Middle East, and Africa, and Asia Pacific. Upon receiving targets, each line of business and, in the case of ES, each Region will build a plan that includes the level of new business and the incremental resources required to achieve the targets. As a professional services people business, the primary resource allocation decisions made by the CODM are focused on hiring fee earners and execution/delivery resources.
As we begin our fiscal year and for each quarterly reporting period, as outlined above, the CODM receives new business and fee revenue reports for each month. For the first two months of a quarter, the CODMs review of segment Adjusted EBITDA is conducted informally, through conversation with the CFO. For the last month of the quarter, the CODM receives the earnings call deck that is fully described in our prior letter. The CODM uses the monthly new business and fee revenue reports and the Adjusted EBITDA from the quarterly earnings call deck to assess performance and to determine if any changes are required for resource allocation decisions i.e., do we stay the course or increase or decrease our hiring activities.
The CODM does not use operating income information even though it is included in the Appendix of the earnings call deck that is provided to him. Instead, he uses Adjusted EBITDA because it facilitates comparisons to historical performance and the financial targets set as part of the AOP process, clearer analyses of potential future performance and forward earnings potential, and the identification of trends, in each case without the distortion that may be caused by less predictable charges and events. In addition, as discussed on our call, the mark-to-market adjustments for assets held in trust for deferred compensation programs is required by US GAAP to be recorded in other income which is below operating income. The mark-to-market adjustment for the deferred compensation obligations is required to be recorded in compensation expense which falls within operating income. These amounts, which essentially offset each other, are both included in Adjusted EBITDA, making that financial metric a more reliable management tool from the CODMs perspective. Last, in our conversations with sell-side and buy-side analysts and portfolio managers, the firms results are always discussed in terms of Adjusted EBITDA, further reinforcing the CODMs use of this financial metric.
On our call, we discussed several changes to our reporting:
| 1) | Tables in our Segment footnote Going forward, we will no longer reconcile operating income to Adjusted EBITDA for Consulting, Digital, RPOPS, each Region for ES, and Corporate. We will not do this because under ASC 280, Adjusted EBITDA is deemed to be a GAAP measure for our reportable segments as it is the measure of profit and loss used by the CODM in allocating resources. We will also eliminate the ES subtotal column, as discussed on our call. With respect to the Consolidated column, ASC 280 specifically requires a reconciliation of the total of reported segment revenues, profit or loss measurement and assets reported by segment to the corresponding consolidated GAAP totals. Accordingly, the reconciliation for Consolidated Adjusted EBITDA will be to Net Income Attributable to Korn Ferry which is deemed to be the closest and most relevant GAAP number. |
To the extent that reconciling items between operating income and Adjusted EBITDA (on a segment basis) are no longer presented but are still required to be disclosed by ASC 280, such amounts will be included in the footnote in narrative format.
See Appendix 1 for mock-up.
2
Note that the table discussed above is also presented in our earnings press release and in our MD&A. Both of those presentations will be changed to be consistent with the table in the footnote with one exception they will include the ES combined subtotal to present our results by our Lines of Business, which is important as a number of our investors analyze our financial results this way. For this combined subtotal, we will also include the reconciliation of combined ES operating income to combined ES Adjusted EBITDA
See tables in the Results of Operations section of the MD&A write-up in Appendix 2.
| 2) | MD&A As we discussed on our call, our MD&A will be modified to align to our segment footnote. More specifically, our discussion around ES Fee Revenue, Compensation and Benefits, General and Administrative Expenses, and Adjusted EBITDA will be done for each Region. We will no longer present a discussion around each of the above areas for combined ES nor will we discuss operating income trends. |
See Appendix 2 for mock-up.
| 3) | Earnings call deck Per the above, the earnings call deck only includes one page for ES and, with the exception of fee revenue, presents the other financial metrics on a combined basis. We have modified the slide so that both Fee Revenue and Adjusted EBITDA are presented on a Regional basis (consistent with how this information has been considered by the CODM historically) in addition to a combined, Line of Business basis. |
See Appendix 3 for mock-up.
We appreciate the Staffs responsiveness with respect to the Companys filing and look forward to resolving any concerns the Staff may have. If you have any questions, please contact me at (310) 226-6366 or Ari Lanin of Gibson, Dunn & Crutcher LLP at (310) 552-8581.
| Sincerely, |
| /s/ Robert P. Rozek |
| Robert P. Rozek |
| Executive Vice President, Chief Financial Officer & Chief Corporate Officer |
| cc: | Don Ferrera, Ernst & Young LLP (via electronic mail) |
Ari Lanin, Gibson, Dunn & Crutcher LLP (via electronic mail)
3
Appendix 1 Table in our Segment footnote
11. Segments
The Company has invested in its digital business over the past year in order to digitize and harmonize the structure of its IP content and data and to build a technology platform for the efficient delivery of these assets directly to an end consumer or indirectly through a consulting engagement. These investments, combined with the acquisition of the Acquired Companies, resulted in a reassessment in the third quarter of fiscal 2020 of how the Company managed its former Advisory business. Given the Companys strategy and development of financial and operational metrics for the consulting and digital businesses, the Companys chief operating decision maker (CODM) had begun to make resource allocation decisions and assess performance separately between Consulting and Digital. Therefore, on November 1, 2019, the Company changed the composition of its global segments, and under the new reporting format, the Advisory segment was separated into two segments: Consulting and Digital. Revenues are directly attributed to a segment and expenses not directly associated with a specific segment are allocated based on the most relevant measures applicable, including revenues, headcount, and other factors.
The Company operates through four lines of business:
| 1. | Consulting helps clients synchronize their strategy and their talent by addressing four fundamental needs: Organizational Strategy, Assessment and Succession, Leadership and Professional Development, and Rewards and Benefits. This work is supported and underpinned by a comprehensive range of some of the worlds leading lP and data. |
| 2. | Digital leverages an artificial intelligence powered platform to identify structure, roles, capabilities, and behaviors needed to drive business forward. This end-to-end system gives clients one enterprise-wide talent framework and delivers an achievable blueprint for success along with the guidance and tools to deliver it. |
| 3. | Executive Search helps organizations recruit board level, chief executive and other senior executive and general management talent. Behavioral interviewing and proprietary assessments are used to determine ideal organizational fit, and salary benchmarking builds appropriate frameworks for compensation and retention. |
| 4. | RPO and Professional Search combines people, process expertise and IP-enabled technology to deliver enterprise talent acquisition solutions to clients. Transaction sizes range from single professional searches to team, department and line of business projects, and global outsource recruiting solutions. |
Executive Search is managed by geographic regional leaders. Worldwide operations for Consulting, Digital, and RPO and Professional Search are managed by their Chief Executive Officers. The Executive Search geographic regional leaders and the Chief Executive Officers of Consulting, Digital, and RPO & Professional Search report directly to the Chief Executive Officer of the Company. The Company also operates a Corporate segment to record global expenses.
The Company evaluates performance and allocates resources based on the CODMs review of 1) fee revenue and 2) adjusted earnings before interest, taxes, depreciation and amortization (Adjusted EBITDA). To the extent that such costs or charges occur, Adjusted EBITDA excludes restructuring charges, integration/acquisition costs, certain separation costs and certain non-cash charges (goodwill, intangible asset and other impairment charges). The CODM is not provided asset information by reportable segment.
Financial highlights by reporting segments are as follows:
| Three Months Ended January 31, 2021 | ||||||||||||||||||||||||||||||||||||
| Executive Search | ||||||||||||||||||||||||||||||||||||
| Consulting | Digital |
North America |
EMEA | Asia Pacific |
Latin America |
RPO & Professional Search |
Corporate | Consolidated | ||||||||||||||||||||||||||||
| (in thousands) | ||||||||||||||||||||||||||||||||||||
| Fee revenue |
$ | 136,268 | $ | 75,791 | $ | 106,002 | $ | 35,991 | $ | 21,643 | $ | 4,468 | $ | 95,197 | $ | | $ | 475,360 | ||||||||||||||||||
| Total revenue |
$ | 136,593 | $ | 75,967 | $ | 106,325 | $ | 36,016 | $ | 21,680 | $ | 4,468 | $ | 96,831 | $ | | $ | 477,880 | ||||||||||||||||||
| Net income attributable to Korn Ferry |
$ | 51,319 | ||||||||||||||||||||||||||||||||||
| Net income attributable to noncontrolling interest |
269 | |||||||||||||||||||||||||||||||||||
| Other income, net |
(14,935 | ) | ||||||||||||||||||||||||||||||||||
| Interest expense, net |
7,298 | |||||||||||||||||||||||||||||||||||
| Income tax provision |
21,204 | |||||||||||||||||||||||||||||||||||
|
|
|
|||||||||||||||||||||||||||||||||||
| Operating income |
$ | 65,155 | ||||||||||||||||||||||||||||||||||
| Depreciation and amortization |
15,735 | |||||||||||||||||||||||||||||||||||
| Other income, net |
14,935 | |||||||||||||||||||||||||||||||||||
| Restructuring charges, net |
838 | |||||||||||||||||||||||||||||||||||
|
|
|
|||||||||||||||||||||||||||||||||||
| Adjusted EBITDA(1) |
$ | 27,515 | $ | 27,134 | $ | 30,941 | $ | 3,918 | $ | 6,375 | $ | 458 | $ | 19,630 | $ | (19,308 | ) | $ | 96,663 | |||||||||||||||||
|
|
|
|||||||||||||||||||||||||||||||||||
| (1) | Adjusted EBITDA refers to earnings before interest, taxes, depreciation and amortization and further excludes net restructuring charges. |
| Three Months Ended January 31, 2020 | ||||||||||||||||||||||||||||||||||||
| Executive Search | ||||||||||||||||||||||||||||||||||||
| Consulting | Digital |
North America |
EMEA | Asia Pacific |
Latin America |
RPO & Professional Search |
Corporate | Consolidated | ||||||||||||||||||||||||||||
| (in thousands) | ||||||||||||||||||||||||||||||||||||
| Fee revenue |
$ | 140,525 | $ | 99,389 | $ | 106,888 | $ | 44,301 | $ | 25,089 | $ | 7,283 | $ | 91,850 | $ | | $ | 515,325 | ||||||||||||||||||
| Total revenue |
$ | 144,298 | $ | 100,663 | $ | 110,230 | $ | 45,077 | $ | 25,365 | $ | 7,351 | $ | 94,995 | $ | | $ | 527,979 | ||||||||||||||||||
| Net income attributable to Korn Ferry |
$ | 19,993 | ||||||||||||||||||||||||||||||||||
| Net income attributable to noncontrolling interest |
963 | |||||||||||||||||||||||||||||||||||
| Other income, net |
(5,055 | ) | ||||||||||||||||||||||||||||||||||
| Interest expense, net |
6,919 | |||||||||||||||||||||||||||||||||||
| Income tax provision |
8,775 | |||||||||||||||||||||||||||||||||||
|
|
|
|||||||||||||||||||||||||||||||||||
| Operating income |
$ | 31,595 | ||||||||||||||||||||||||||||||||||
| Depreciation and amortization |
14,863 | |||||||||||||||||||||||||||||||||||
| Other income, net |
5,055 | |||||||||||||||||||||||||||||||||||
| Integration/acquisition costs |
6,704 | |||||||||||||||||||||||||||||||||||
| Restructuring charges, net |
18,093 | |||||||||||||||||||||||||||||||||||
| Separation costs |
1,783 | |||||||||||||||||||||||||||||||||||
|
|
|
|||||||||||||||||||||||||||||||||||
| Adjusted EBITDA(1) |
$ | 18,699 | $ | 25,852 | $ | 26,618 | $ | 6,878 | $ | 5,505 | $ | 1,655 | $ | 15,211 | $ | (22,325 | ) | $ | 78,093 | |||||||||||||||||
|
|
|
|||||||||||||||||||||||||||||||||||
| (1) | Adjusted EBITDA refers to earnings before interest, taxes, depreciation and amortization and further excludes integration/acquisition costs, net restructuring charges and separation costs. |
| Nine Months Ended January 31, 2021 | ||||||||||||||||||||||||||||||||||||
| Executive Search | ||||||||||||||||||||||||||||||||||||
| Consulting | Digital |
North America |
EMEA | Asia Pacific |
Latin America |
RPO & Professional Search |
Corporate | Consolidated | ||||||||||||||||||||||||||||
| (in thousands) | ||||||||||||||||||||||||||||||||||||
| Fee revenue |
$ | 362,271 | $ | 206,807 | $ | 266,485 | $ | 97,701 | $ | 59,702 | $ | 12,419 | $ | 249,511 | $ | | $ | 1,254,896 | ||||||||||||||||||
| Total revenue |
$ | 363,234 | $ | 207,027 | $ | 267,790 | $ | 97,925 | $ | 59,840 | $ | 12,419 | $ | 254,317 | $ | | $ | 1,262,552 | ||||||||||||||||||
| Net income attributable to Korn Ferry |
$ | 48,264 | ||||||||||||||||||||||||||||||||||
| Net income attributable to noncontrolling interest |
547 | |||||||||||||||||||||||||||||||||||
| Other income, net |
(26,374 | ) | ||||||||||||||||||||||||||||||||||
| Interest expense, net |
21,686 | |||||||||||||||||||||||||||||||||||
| Income tax provision |
25,409 | |||||||||||||||||||||||||||||||||||
|
|
|
|||||||||||||||||||||||||||||||||||
| Operating income |
$ | 69,532 | ||||||||||||||||||||||||||||||||||
| Depreciation and amortization |
46,068 | |||||||||||||||||||||||||||||||||||
| Other income, net |
26,374 | |||||||||||||||||||||||||||||||||||
| Integration/acquisition costs |
737 | |||||||||||||||||||||||||||||||||||
| Restructuring charges, net |
30,732 | |||||||||||||||||||||||||||||||||||
|
|
|
|||||||||||||||||||||||||||||||||||
| Adjusted EBITDA(1) |
$ | 54,282 | $ | 58,161 | $ | 57,439 | $ | 8,445 | $ | 11,610 | $ | 480 | $ | 39,453 | $ | (56,427 | ) | $ | 173,443 | |||||||||||||||||
|
|
|
|||||||||||||||||||||||||||||||||||
| (1) | Adjusted EBITDA refers to earnings before interest, taxes, depreciation and amortization and further excludes, integration/acquisition costs and net restructuring charges. |
| Nine Months Ended January 31, 2020 | ||||||||||||||||||||||||||||||||||||
| Executive Search | ||||||||||||||||||||||||||||||||||||
| Consulting | Digital |
North America |
EMEA | Asia Pacific |
Latin America |
RPO & Professional Search |
Corporate | Consolidated | ||||||||||||||||||||||||||||
| (in thousands) | ||||||||||||||||||||||||||||||||||||
| Fee revenue |
$ | 422,103 | $ | 223,097 | $ | 332,428 | $ | 130,652 | $ | 78,395 | $ | 23,140 | $ | 282,448 | $ | | $ | 1,492,263 | ||||||||||||||||||
| Total revenue |
$ | 433,832 | $ | 224,371 | $ | 342,753 | $ | 132,830 | $ | 79,201 | $ | 23,211 | $ | 292,156 | $ | | $ | 1,528,354 | ||||||||||||||||||
| Net income attributable to Korn Ferry |
$ | 105,748 | ||||||||||||||||||||||||||||||||||
| Net income attributable to noncontrolling interest |
1,890 | |||||||||||||||||||||||||||||||||||
| Other income, net |
(8,014 | ) | ||||||||||||||||||||||||||||||||||
| Interest expense, net |
15,186 | |||||||||||||||||||||||||||||||||||
| Income tax provision |
38,988 | |||||||||||||||||||||||||||||||||||
|
|
|
|||||||||||||||||||||||||||||||||||
| Operating income |
$ | 153,798 | ||||||||||||||||||||||||||||||||||
| Depreciation and amortization |
40,355 | |||||||||||||||||||||||||||||||||||
| Other income, net |
8,014 | |||||||||||||||||||||||||||||||||||
| Integration/acquisition costs |
9,319 | |||||||||||||||||||||||||||||||||||
| Restructuring charges, net |
18,093 | |||||||||||||||||||||||||||||||||||
| Separation costs |
1,783 | |||||||||||||||||||||||||||||||||||
|
|
|
|||||||||||||||||||||||||||||||||||
| Adjusted EBITDA(1) |
$ | 49,990 | $ | 66,084 | $ | 88,611 | $ | 21,725 | $ | 19,063 | $ | 4,186 | $ | 47,456 | $ | (65,753 | ) | $ | 231,362 | |||||||||||||||||
|
|
|
|||||||||||||||||||||||||||||||||||
| (1) | Adjusted EBITDA refers to earnings before interest, taxes, depreciation and amortization and further excludes integration/acquisition costs, net restructuring charges and separation costs. |
Appendix 2 Introduction to MD&A
Results of Operations
The following table summarizes the results of our operations as a percentage of fee revenue:
(Numbers may not total exactly due to rounding)
|
Three Months Ended January 31, |
Nine Months Ended January 31, |
|||||||||||||||
| 2021 | 2020 | 2021 | 2020 | |||||||||||||
| Fee revenue |
100.0 | % | 100.0 | % | 100.0 | % | 100.0 | % | ||||||||
| Reimbursed out-of-pocket engagement expenses |
0.5 | 2.5 | 0.6 | 2.4 | ||||||||||||
|
|
|
|
|
|
|
|
|
|||||||||
| Total revenue |
100.5 | 102.5 | 100.6 | 102.4 | ||||||||||||
| Compensation and benefits |
68.6 | 67.6 | 73.1 | 68.0 | ||||||||||||
| General and administrative expenses |
9.9 | 13.8 | 11.2 | 13.3 | ||||||||||||
| Reimbursed expenses |
0.5 | 2.5 | 0.6 | 2.4 | ||||||||||||
| Cost of services |
4.2 | 6.0 | 4.0 | 4.4 | ||||||||||||
| Depreciation and amortization |
3.3 | 2.9 | 3.7 | 2.7 | ||||||||||||
| Restructuring charges, net |
0.2 | 3.5 | 2.4 | 1.2 | ||||||||||||
|
|
|
|
|
|
|
|
|
|||||||||
| Operating income |
13.7 | 6.1 | 5.5 | 10.3 | ||||||||||||
|
|
|
|
|
|
|
|
|
|||||||||
| Net income |
10.9 | % | 4.1 | % | 3.9 | % | 7.2 | % | ||||||||
|
|
|
|
|
|
|
|
|
|||||||||
| Net income attributable to Korn Ferry |
10.8 | % | 3.9 | % | 3.8 | % | 7.1 | % | ||||||||
|
|
|
|
|
|
|
|
|
|||||||||
The following tables summarize the results of our operations:
(Numbers may not total exactly due to rounding)
|
Three Months Ended January 31, |
Nine Months Ended January 31, |
|||||||||||||||||||||||||||||||
| 2021 | 2020 | 2021 | 2020 | |||||||||||||||||||||||||||||
| Dollars | % | Dollars | % | Dollars | % | Dollars | % | |||||||||||||||||||||||||
| (dollars in thousands) | ||||||||||||||||||||||||||||||||
| Fee revenue |
||||||||||||||||||||||||||||||||
| Consulting |
$ | 136,268 | 28.7 | % | $ | 140,525 | 27.3 | % | $ | 362,271 | 28.9 | % | $ | 422,103 | 28.3 | % | ||||||||||||||||
| Digital |
75,791 | 15.9 | 99,389 | 19.3 | 206,807 | 16.5 | 223,097 | 15.0 | ||||||||||||||||||||||||
| Executive Search: |
||||||||||||||||||||||||||||||||
| North America |
106,002 | 22.3 | 106,888 | 20.7 | 266,485 | 21.2 | 332,428 | 22.3 | ||||||||||||||||||||||||
| EMEA |
35,991 | 7.6 | 44,301 | 8.6 | 97,701 | 7.8 | 130,652 | 8.8 | ||||||||||||||||||||||||
| Asia Pacific |
21,643 | 4.6 | 25,089 | 4.9 | 59,702 | 4.8 | 78,395 | 5.3 | ||||||||||||||||||||||||
| Latin America |
4,468 | 0.9 | 7,283 | 1.4 | 12,419 | 1.0 | 23,140 | 1.6 | ||||||||||||||||||||||||
|
|
|
|
|
|
|
|
|
|
|
|
|
|
|
|
|
|||||||||||||||||
| Total Executive Search |
168,104 | 35.4 | 183,561 | 35.6 | 436,307 | 34.8 | 564,615 | 37.8 | ||||||||||||||||||||||||
| RPO & Professional Search |
95,197 | 20.0 | 91,850 | 17.8 | 249,511 | 19.9 | 282,448 | 18.9 | ||||||||||||||||||||||||
|
|
|
|
|
|
|
|
|
|
|
|
|
|
|
|
|
|||||||||||||||||
| Total fee revenue |
475,360 | 100.0 | % | 515,325 | 100.0 | % | 1,254,896 | 100.0 | % | 1,492,263 | 100.0 | % | ||||||||||||||||||||
|
|
|
|
|
|
|
|
|
|||||||||||||||||||||||||
| Reimbursed out-of-pocket engagement expense |
2,520 | 12,654 | 7,656 | 36,091 | ||||||||||||||||||||||||||||
|
|
|
|
|
|
|
|
|
|||||||||||||||||||||||||
| Total revenue |
$ | 477,880 | $ | 527,979 | $ | 1,262,552 | $ | 1,528,354 | ||||||||||||||||||||||||
|
|
|
|
|
|
|
|
|
|||||||||||||||||||||||||
|
Three Months Ended January 31, |
Nine Months Ended January 31, |
|||||||||||||||||||||||||||||||
| 2021 | 2020 | 2021 | 2020 | |||||||||||||||||||||||||||||
| Dollars | Margin (1) | Dollars | Margin (1) | Dollars | Margin (1) | Dollars | Margin (1) | |||||||||||||||||||||||||
| (dollars in thousands) | ||||||||||||||||||||||||||||||||
| Operating income |
||||||||||||||||||||||||||||||||
| Consulting |
$ | 22,175 | 16.3 | % | $ | 2,663 | 1.9 | % | $ | 25,869 | 7.1 | % | $ | 24,272 | 5.8 | % | ||||||||||||||||
| Digital |
19,214 | 25.4 | 8,463 | 8.5 | 32,410 | 15.7 | 41,036 | 18.4 | ||||||||||||||||||||||||
| Executive Search: |
||||||||||||||||||||||||||||||||
| North America |
17,655 | 16.7 | 21,808 | 20.4 | 32,411 | 12.2 | 80,254 | 24.1 | ||||||||||||||||||||||||
| EMEA |
3,114 | 8.7 | 4,644 | 10.5 | (1,596 | ) | (1.6 | ) | 18,466 | 14.1 | ||||||||||||||||||||||
| Asia Pacific |
5,844 | 27.0 | 5,070 | 20.2 | 9,958 | 16.7 | 17,866 | 22.8 | ||||||||||||||||||||||||
| Latin America |
264 | 5.9 | 1,198 | 16.4 | (578 | ) | (4.7 | ) | 2,999 | 13.0 | ||||||||||||||||||||||
|
|
|
|
|
|
|
|
|
|||||||||||||||||||||||||
| Total Executive Search |
26,877 | 16.0 | 32,720 | 17.8 | 40,195 | 9.2 | 119,585 | 21.2 | ||||||||||||||||||||||||
| RPO & Professional Search |
18,360 | 19.3 | 14,144 | 15.4 | 33,027 | 13.2 | 44,279 | 15.7 | ||||||||||||||||||||||||
| Corporate |
(21,471 | ) | (26,395 | ) | (61,969 | ) | (75,374 | ) | ||||||||||||||||||||||||
|
|
|
|
|
|
|
|
|
|||||||||||||||||||||||||
| Total operating income |
$ | 65,155 | 13.7 | % | $ | 31,595 | 6.1 | % | $ | 69,532 | 5.5 | % | $ | 153,798 | 10.3 | % | ||||||||||||||||
|
|
|
|
|
|
|
|
|
|||||||||||||||||||||||||
| (1) | Margin calculated as a percentage of fee revenue by segment. |
| Three Months Ended January 31, 2021 | ||||||||||||||||||||||||||||||||||||||||
| Executive Search | ||||||||||||||||||||||||||||||||||||||||
| Consulting | Digital |
North America |
EMEA | Asia Pacific |
Latin America |
Subtotal |
RPO & Professional Search |
Corporate | Consolidated | |||||||||||||||||||||||||||||||
| (in thousands) | ||||||||||||||||||||||||||||||||||||||||
| Fee revenue |
$ | 136,268 | $ | 75,791 | $ | 106,002 | $ | 35,991 | $ | 21,643 | $ | 4,468 | $ | 168,104 | $ | 95,197 | $ | | $ | 475,360 | ||||||||||||||||||||
| Total revenue |
$ | 136,593 | $ | 75,967 | $ | 106,325 | $ | 36,016 | $ | 21,680 | $ | 4,468 | $ | 168,489 | $ | 96,831 | $ | | $ | 477,880 | ||||||||||||||||||||
| Net income attributable to Korn Ferry |
$ | 51,319 | ||||||||||||||||||||||||||||||||||||||
| Net income attributable to noncontrolling interest |
269 | |||||||||||||||||||||||||||||||||||||||
| Other income, net |
(14,935 | ) | ||||||||||||||||||||||||||||||||||||||
| Interest expense, net |
7,298 | |||||||||||||||||||||||||||||||||||||||
| Income tax provision |
21,204 | |||||||||||||||||||||||||||||||||||||||
|
|
|
|||||||||||||||||||||||||||||||||||||||
| Operating income |
$ | 26,877 | $ | 65,155 | ||||||||||||||||||||||||||||||||||||
| Depreciation and amortization |
1,449 | 15,735 | ||||||||||||||||||||||||||||||||||||||
| Other income, net |
12,996 | 14,935 | ||||||||||||||||||||||||||||||||||||||
| Restructuring charges, net |
370 | 838 | ||||||||||||||||||||||||||||||||||||||
|
|
|
|
|
|||||||||||||||||||||||||||||||||||||
| Adjusted EBITDA |
$ | 27,515 | $ | 27,134 | $ | 30,941 | $ | 3,918 | $ | 6,375 | $ | 458 | $ | 41,692 | $ | 19,630 | $ | (19,308 | ) | $ | 96,663 | |||||||||||||||||||
|
|
|
|
|
|||||||||||||||||||||||||||||||||||||
| Adjusted EBITDA margin |
20.2 | % | 35.8 | % | 29.2 | % | 10.9 | % | 29.5 | % | 10.3 | % | 24.8 | % | 20.6 | % | 20.3 | % | ||||||||||||||||||||||
| Three Months Ended January 31, 2020 | ||||||||||||||||||||||||||||||||||||||||
| Executive Search | ||||||||||||||||||||||||||||||||||||||||
| Consulting | Digital |
North America |
EMEA | Asia Pacific |
Latin America |
Subtotal |
RPO & Professional Search |
Corporate | Consolidated | |||||||||||||||||||||||||||||||
| (in thousands) | ||||||||||||||||||||||||||||||||||||||||
| Fee revenue |
$ | 140,525 | $ | 99,389 | $ | 106,888 | $ | 44,301 | $ | 25,089 | $ | 7,283 | $ | 183,561 | $ | 91,850 | $ | | $ | 515,325 | ||||||||||||||||||||
| Total revenue |
$ | 144,298 | $ | 100,663 | $ | 110,230 | $ | 45,077 | $ | 25,365 | $ | 7,351 | $ | 188,023 | $ | 94,995 | $ | | $ | 527,979 | ||||||||||||||||||||
| Net income attributable to Korn Ferry |
$ | 19,993 | ||||||||||||||||||||||||||||||||||||||
| Net income attributable to noncontrolling interest |
963 | |||||||||||||||||||||||||||||||||||||||
| Other income, net |
(5,055 | ) | ||||||||||||||||||||||||||||||||||||||
| Interest expense, net |
6,919 | |||||||||||||||||||||||||||||||||||||||
| Income tax provision |
8,775 | |||||||||||||||||||||||||||||||||||||||
|
|
|
|||||||||||||||||||||||||||||||||||||||
| Operating income loss |
$ | 32,720 | $ | 31,595 | ||||||||||||||||||||||||||||||||||||
| Depreciation and amortization |
1,893 | 14,863 | ||||||||||||||||||||||||||||||||||||||
| Other income, net |
4,260 | 5,055 | ||||||||||||||||||||||||||||||||||||||
| Integration/acquisition costs |
| 6,704 | ||||||||||||||||||||||||||||||||||||||
| Restructuring charges, net |
| 18,093 | ||||||||||||||||||||||||||||||||||||||
| Separation costs |
1,783 | 1,783 | ||||||||||||||||||||||||||||||||||||||
|
|
|
|
|
|||||||||||||||||||||||||||||||||||||
| Adjusted EBITDA |
$ | 18,699 | $ | 25,852 | $ | 26,618 | $ | 6,878 | $ | 5,505 | $ | 1,655 | $ | 40,656 | $ | 15,211 | $ | (22,325 | ) | $ | 78,093 | |||||||||||||||||||
|
|
|
|
|
|||||||||||||||||||||||||||||||||||||
| Adjusted EBITDA margin |
13.3 | % | 26.0 | % | 24.9 | % | 15.5 | % | 21.9 | % | 22.7 | % | 22.1 | % | 16.6 | % | 15.2 | % | ||||||||||||||||||||||
| Nine Months Ended January 31, 2021 | ||||||||||||||||||||||||||||||||||||||||
| Executive Search | ||||||||||||||||||||||||||||||||||||||||
| Consulting | Digital |
North America |
EMEA | Asia Pacific |
Latin America |
Subtotal |
RPO & Professional Search |
Corporate | Consolidated | |||||||||||||||||||||||||||||||
| (in thousands) | ||||||||||||||||||||||||||||||||||||||||
| Fee revenue |
$ | 362,271 | $ | 206,807 | $ | 266,485 | $ | 97,701 | $ | 59,702 | $ | 12,419 | $ | 436,307 | $ | 249,511 | $ | | $ | 1,254,896 | ||||||||||||||||||||
| Total revenue |
$ | 363,234 | $ | 207,027 | $ | 267,790 | $ | 97,925 | $ | 59,840 | $ | 12,419 | $ | 437,974 | $ | 254,317 | $ | | $ | 1,262,552 | ||||||||||||||||||||
| Net income attributable to Korn Ferry |
$ | 48,264 | ||||||||||||||||||||||||||||||||||||||
| Net income attributable to noncontrolling interest |
547 | |||||||||||||||||||||||||||||||||||||||
| Other income, net |
(26,374 | ) | ||||||||||||||||||||||||||||||||||||||
| Interest expense, net |
21,686 | |||||||||||||||||||||||||||||||||||||||
| Income tax provision |
25,409 | |||||||||||||||||||||||||||||||||||||||
|
|
|
|||||||||||||||||||||||||||||||||||||||
| Operating income |
$ | 40,195 | $ | 69,532 | ||||||||||||||||||||||||||||||||||||
| Depreciation and amortization |
4,541 | 46,068 | ||||||||||||||||||||||||||||||||||||||
| Other income, net |
22,826 | 26,374 | ||||||||||||||||||||||||||||||||||||||
| Integration/acquisition costs |
| 737 | ||||||||||||||||||||||||||||||||||||||
| Restructuring charges, net |
10,412 | 30,732 | ||||||||||||||||||||||||||||||||||||||
|
|
|
|
|
|||||||||||||||||||||||||||||||||||||
| Adjusted EBITDA |
$ | 54,282 | $ | 58,161 | $ | 57,439 | $ | 8,445 | $ | 11,610 | $ | 480 | $ | 77,974 | $ | 39,453 | $ | (56,427 | ) | $ | 173,443 | |||||||||||||||||||
|
|
|
|
|
|||||||||||||||||||||||||||||||||||||
| Adjusted EBITDA margin |
15.0 | % | 28.1 | % | 21.6 | % | 8.6 | % | 19.4 | % | 3.9 | % | 17.9 | % | 15.8 | % | 13.8 | % | ||||||||||||||||||||||
| Nine Months Ended January 31, 2020 | ||||||||||||||||||||||||||||||||||||||||
| Executive Search | ||||||||||||||||||||||||||||||||||||||||
| Consulting | Digital |
North America |
EMEA | Asia Pacific |
Latin America |
Subtotal |
RPO & Professional Search |
Corporate | Consolidated | |||||||||||||||||||||||||||||||
| (in thousands) | ||||||||||||||||||||||||||||||||||||||||
| Fee revenue |
$ | 422,103 | $ | 223,097 | $ | 332,428 | $ | 130,652 | $ | 78,395 | $ | 23,140 | $ | 564,615 | $ | 282,448 | $ | | $ | 1,492,263 | ||||||||||||||||||||
| Total revenue |
$ | 433,832 | $ | 224,371 | $ | 342,753 | $ | 132,830 | $ | 79,201 | $ | 23,211 | $ | 577,995 | $ | 292,156 | $ | | $ | 1,528,354 | ||||||||||||||||||||
| Net income attributable to Korn Ferry |
$ | 105,748 | ||||||||||||||||||||||||||||||||||||||
| Net income attributable to noncontrolling interest |
1,890 | |||||||||||||||||||||||||||||||||||||||
| Other income, net |
(8,014 | ) | ||||||||||||||||||||||||||||||||||||||
| Interest expense, net |
15,186 | |||||||||||||||||||||||||||||||||||||||
| Income tax provision |
38,988 | |||||||||||||||||||||||||||||||||||||||
|
|
|
|||||||||||||||||||||||||||||||||||||||
| Operating income |
$ | 119,585 | $ | 153,798 | ||||||||||||||||||||||||||||||||||||
| Depreciation and amortization |
5,887 | 40,355 | ||||||||||||||||||||||||||||||||||||||
| Other income, net |
6,330 | 8,014 | ||||||||||||||||||||||||||||||||||||||
| Integration/acquisition costs |
| 9,319 | ||||||||||||||||||||||||||||||||||||||
| Restructuring charges, net |
| 18,093 | ||||||||||||||||||||||||||||||||||||||
| Separation costs |
1,783 | 1,783 | ||||||||||||||||||||||||||||||||||||||
|
|
|
|
|
|||||||||||||||||||||||||||||||||||||
| Adjusted EBITDA |
$ | 49,990 | $ | 66,084 | $ | 88,611 | $ | 21,725 | $ | 19,063 | $ | 4,186 | $ | 133,585 | $ | 47,456 | $ | (65,753 | ) | $ | 231,362 | |||||||||||||||||||
|
|
|
|
|
|||||||||||||||||||||||||||||||||||||
| Adjusted EBITDA margin |
11.8 | % | 29.6 | % | 26.7 | % | 16.6 | % | 24.3 | % | 18.1 | % | 23.7 | % | 16.8 | % | 15.5 | % | ||||||||||||||||||||||
Three Months Ended January 31, 2021 Compared to Three Months Ended January 31, 2020
Fee Revenue
Executive Search North America reported fee revenue of $106.0 million, a decrease of $0.9 million, or 1%, in the three months ended January 31, 2021 compared to $106.9 million in the year-ago quarter. The decrease in fee revenue was due to an 8% decrease in the number of engagements billed, partially offset by a 7% increase in the weighted-average fee billed per engagement (calculated using local currency) during the three months ended January 31, 2021 compared to the year-ago quarter.
Executive Search EMEA reported fee revenue of $36.0 million, a decrease of $8.3 million, or 19%, in the three months ended January 31, 2021 compared to $44.3 million in the year-ago quarter. The decrease in fee revenue was due to a 20% decrease in the number of engagements billed and a 4% decrease in the weighted-average fee billed per engagement (calculated using local currency) during the three months ended January 31, 2021 compared to the year-ago quarter. Exchange rates favorably impacted fee revenue by $2.4 million, or 5%, in the three months ended January 31, 2021 compared to the year-ago quarter. Performance in the United Kingdom, Switzerland, Germany and France were the primary contributors to the decrease in fee revenue in the three months ended January 31, 2021 compared to the year-ago quarter.
Executive Search Asia Pacific reported fee revenue of $21.6 million, a decrease of $3.5 million, or 14%, in the three months ended January 31, 2021 compared to $25.1 million in the year-ago quarter. The decrease in fee revenue was due to a 17% decrease in the weighted-average fees billed per engagement (calculated using local currency) during the three months ended January 31, 2021 compared to the year-ago quarter. Exchange rates favorably impacted fee revenue by $1.0 million, or 4%, in the three months ended January 31, 2021 compared to the year-ago quarter. The performance in Australia, Singapore and Hong Kong were the primary contributors to the decrease in fee revenue in the three months ended January 31, 2021 compared to the year-ago quarter.
Executive Search Latin America reported fee revenue of $4.5 million, a decrease of $2.8 million, or 38%, in the three months ended January 31, 2021 compared to $7.3 million in the year-ago quarter. The decrease in fee revenue was due to a 39% decrease in the number of engagements billed partially offset by a 10% increase in the weighted-average fee billed per engagement (calculated using local currency) during the three months ended January 31, 2021 compared to the year-ago quarter. Exchange rates unfavorably impacted fee revenue by $0.7 million, or 10%, in the three months ended January 31, 2021 compared to the year-ago quarter. The decrease in fee revenue in the region was due to lower fee revenue in Mexico, Chile and Brazil in the three months ended January 31, 2021 compared to the year-ago quarter.
Compensation and Benefits
Executive Search North America compensation and benefits expense increased by $7.5 million, or 10%, to $80.8 million in the three months ended January 31, 2021 from $73.3 million in the year-ago quarter. The increase in compensation and benefits expense was due to expenses associated with our deferred compensation and retirement plans driven by increases in the fair value of participants accounts in the three months ended January 31, 2021 compared to the year-ago quarter. This was partially offset by lower salaries and related payroll taxes due to a 24% decrease in average headcount as a result of actions taken to align our cost structure with the lower level of business demand in the three months ended January 31, 2021 compared to the year-ago quarter. North America Executive Search compensation and benefits expense, as a percentage of fee revenue, increased to 76% in the three months ended January 31, 2021 from 69% in the year-ago quarter.
Executive Search EMEA compensation and benefits expense decreased by $5.9 million, or 18%, to $27.8 million in the three months ended January 31, 2021 from $33.7 million in the year-ago quarter. Exchange rates unfavorably impacted compensation and benefits by $1.9 million, or 6%, in the three months ended January 31, 2021 compared to the year-ago quarter. The decrease in compensation and benefits expense was due to lower salaries and related payroll taxes and performance-related bonus expense both due to a 16% decrease in average headcount as a result of actions taken to align our cost structure with the lower level of business demand in the three months ended January 31, 2021 compared to the year-ago quarter. The rest of the change was due to lower severance expense due to management separation costs incurred in the year-ago quarter. EMEA Executive Search compensation and benefits expense, as a percentage of fee revenue, increased to 77% in the three months ended January 31, 2021 from 76% in the year-ago quarter.
Executive Search Asia Pacific compensation and benefits expense decreased by $3.6 million, or 21%, to $13.3 million in the three months ended January 31, 2021 from $16.9 million in the year-ago quarter. Exchange rates unfavorably impacted compensation and benefits by $0.6 million, or 4%, in the three months ended January 31, 2021 compared to the year-ago quarter. The decrease in compensation and benefits expense was due to lower salaries and related payroll taxes and performance-related bonus expense both due to a 23% decrease in average headcount as a result of actions taken to align our cost structure with the lower level of business demand in the three months ended January 31, 2021 compared to the year-ago quarter. Asia Pacific Executive Search compensation and benefits expense, as a percentage of fee revenue, decreased to 62% in the three months ended January 31, 2021 from 67% in the year-ago quarter.
Executive Search Latin America compensation and benefits expense decreased by $1.3 million, or 27%, to $3.5 million in the three months ended January 31, 2021 from $4.8 million in the year-ago quarter. Exchange rates favorably impacted compensation and benefits by $0.6 million, or 13%, in the three months ended January 31, 2021 compared to the year-ago quarter. The decrease in compensation and benefits expense was due to lower salaries and related payroll taxes and performance-related bonus expense due to a 25% decrease in average headcount as a result of actions taken to align our cost structure with the lower level of business demand in the three months ended January 31, 2021 compared to the year-ago quarter. Latin America Executive Search compensation and benefits expense, as a percentage of fee revenue, increased to 78% in the three months ended January 31, 2021 from 66% in the year-ago quarter.
General and Administrative Expenses
Executive Search North America general and administrative expenses decreased by $4.3 million, or 42%, to $5.9 million, in the three months ended January 31, 2021 compared to $10.2 million in the year-ago quarter. The decrease was mainly due to decreases in marketing and business development expenses, premise and office expenses and travel related expenses as a result of actions taken to align our cost structure with the lower level of business demand. North America Executive Search general and administrative expenses, as a percentage of fee revenue, decreased to 6% in the three months ended January 31, 2021 from 10% in the year-ago quarter.
Executive Search EMEA general and administrative expenses decreased by $1.1 million, or 20%, to $4.3 million, in the three months ended January 31, 2021 compared to $5.4 million in the year-ago quarter. The decrease was mainly due to decreases in marketing and business development expenses and travel related expenses as a result of actions taken to align our cost structure with the lower level of business demand. EMEA Executive Search general and administrative expenses, as a percentage of fee revenue, was 12% in both the three months ended January 31, 2021 and 2020.
Executive Search Asia Pacific general and administrative expenses decreased by $0.4 million, or 16%, to $2.1 million, in the three months ended January 31, 2021 compared to $2.5 million in the year-ago quarter. The decrease was mainly due to decreases in marketing and business development expenses, premise and office expenses and travel related expenses as a result of actions taken to align our cost structure with the lower level of business demand. Asia Pacific Executive Search general and administrative expenses, as a percentage of fee revenue, was 10% in both the three months ended January 31, 2021 and 2020.
Executive Search Latin America general and administrative expenses decreased by $0.6 million, or 55%, to $0.5 million, in the three months ended January 31, 2021 compared to $1.1 million in the year-ago quarter. The decrease was mainly due to decreases in premise and office expenses as a result of actions taken to align our cost structure with the lower level of business demand. Latin America Executive Search general and administrative expenses, as a percentage of fee revenue, decreased to 11% in the three months ended January 31, 2021 from 15% in the year-ago quarter.
Adjusted EBITDA
Executive Search North America Adjusted EBITDA increased $4.3 million, or 16%, to $30.9 million in the three months ended January 31, 2021 as compared to $26.6 million in the year-ago quarter. The increase was mainly driven by decreases in general and administrative expenses, which resulted from cost savings initiatives that were put in place in response to the COVID-19 pandemic. These changes were partially offset by lower fee revenue. North America Executive Search Adjusted EBITDA, as a percentage of fee revenue, was 29% and 25% in the three months ended January 31, 2021 and 2020, respectively.
Executive Search EMEA Adjusted EBITDA decreased $3.0 million, or 43%, to $3.9 million in the three months ended January 31, 2021 as compared to $6.9 million in the year-ago quarter. The decrease was mainly driven by lower fee revenue, which were partially offset by decreases in general and administrative expenses and compensation and benefits expense (excluding separation costs), all of which resulted from cost savings initiatives that were put in place in response to the COVID-19 pandemic. EMEA Executive Search Adjusted EBITDA, as a percentage of fee revenue, was 11% and 16% in the three months ended January 31, 2021 and 2020, respectively.
Executive Search Asia Pacific Adjusted EBITDA increased $0.9 million, or 16%, to $6.4 million in the three months ended January 31, 2021 as compared to $5.5 million in the year-ago quarter. The increase was mainly driven by decreases in general and administrative expenses and compensation and benefits expense, all of which resulted from cost savings initiatives that were put in place in response to the COVID-19 pandemic. These changes were partially offset by lower fee revenue. Asia Pacific Executive Search Adjusted EBITDA, as a percentage of fee revenue, was 29% and 22% in the three months ended January 31, 2021 and 2020, respectively.
Executive Search Latin America Adjusted EBITDA decreased $1.2 million, or 71%, to $0.5 million in the three months ended January 31, 2021 as compared to $1.7 million in the year-ago quarter. The decrease was mainly driven by a decline in fee revenue, partially offset by decreases in general and administrative expenses and compensation and benefits expense, all of which resulted from cost savings initiatives that were put in place in response to the COVID-19 pandemic. Latin America Executive Search Adjusted EBITDA, as a percentage of fee revenue, was 10% and 23% in the three months ended January 31, 2021 and 2020, respectively.
Appendix 3 ES Slide from our Earnings Call Deck
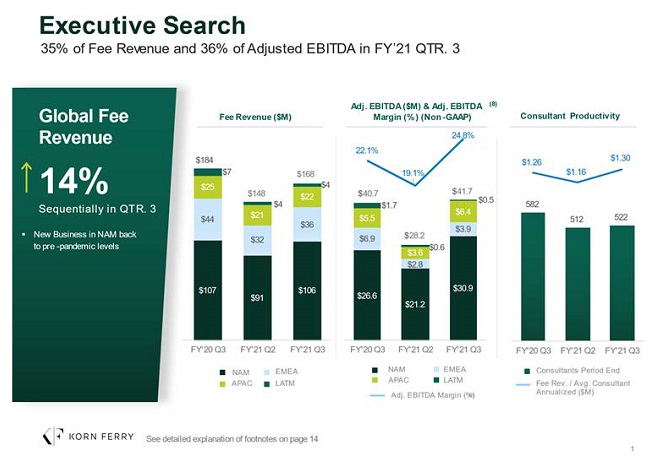
Executive Search
35% of Revenue and 36% of
Adjusted EBITDA in FY21 QTR. 3